
Flood detention area digital twin
An auxiliary decision platform for a flood detention area on the lower Yellow River: four counties, ...
View Details →Why It Is Hard
A detention area is the last card in the flood-control hand: on ordinary days it is home to 1,600 villages, and in an extreme flood it is 2 billion cubic metres of storage. The card may be played once in decades, and the price of playing it is hundreds of thousands of people leaving overnight. So the decision-maker faces a brutal trade: not using it risks the downstream; using it may flood the area for nothing. The platform exists to close that information gap.
Policy background: the Ministry of Water Resources guidance on digital twins for reservoirs, sluices and detention areas (2024, No. 269) sets 2027 for advancing national detention-area digital twins and 2030 for completion; the 2024 flood-defence work plan likewise encourages “digital mapping, intelligent simulation and forward-looking rehearsal”. The six-menu structure follows that forecast-warning-rehearsal-plan framework.
The Area
A detention area is not a reservoir. It is a valley floor pinched between two levees: the south levee is the Yellow River dike, the north levee is a historical embankment, and between them the strip is at most a dozen kilometres wide and about 140 km long. When it operates, water enters through the upstream sluice, spreads from the low ground outward, and finally leaves through the downstream outlet. Only with that bowl in mind does it make sense that the same discharge level means completely different risk in different villages.
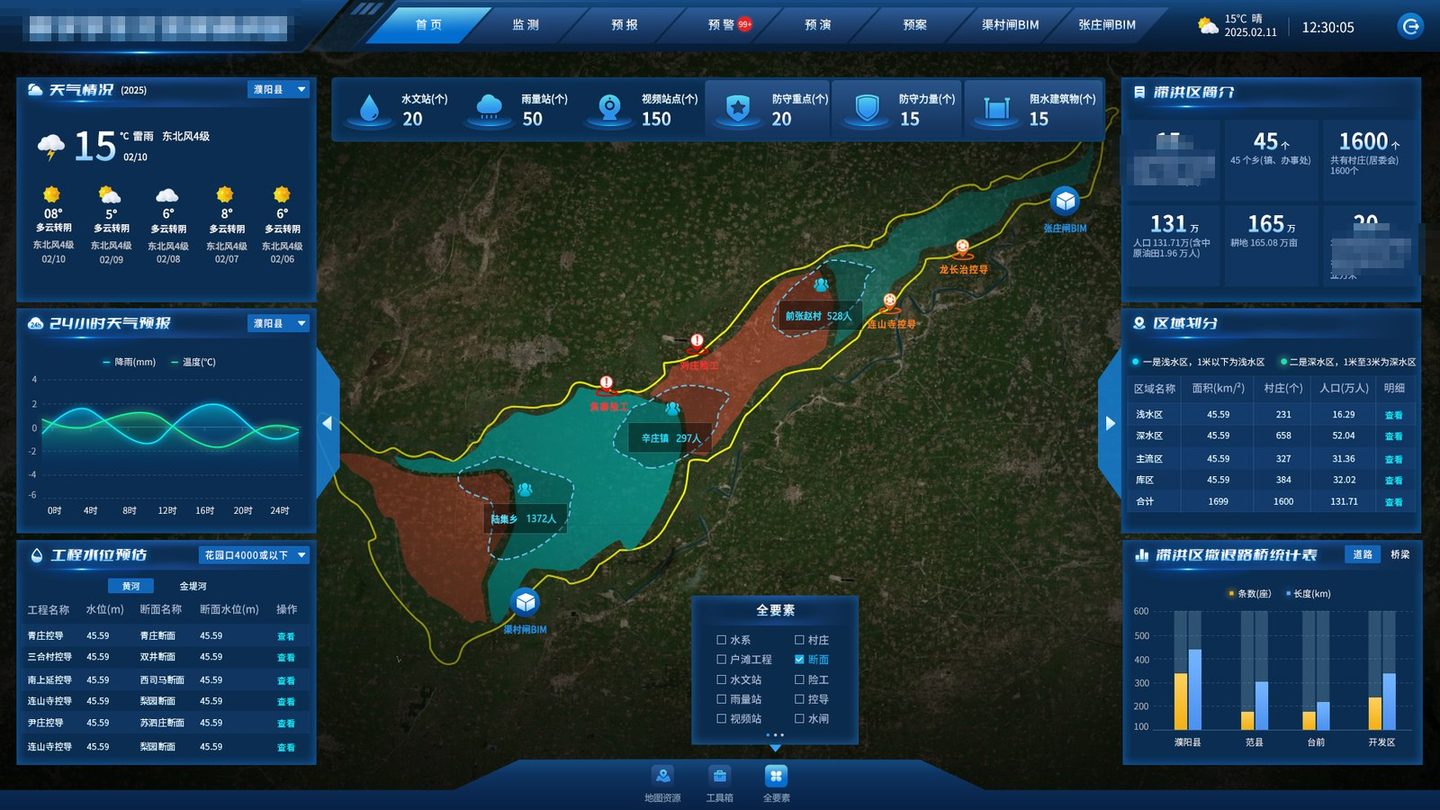
The platform cuts the area into shallow, deep, main-flow and basin zones, each carrying a village count and a population. This is not decoration: evacuation order, shelter assignment and compensation all follow the zone. The deep zone — 658 villages, 528,400 people — is the bulk of the evacuation; the shallow zone has fewer people but dries out first, so it is usually the first cohort to return.
Putting the four zones in one table has a second effect: it forces the data to reconcile. The four must add up to 1,600 villages and 1.3171 million people, and one missing village sends someone back to check. The table is the reconciliation sheet.
| Zone | Villages | People (000) |
|---|---|---|
| Shallow | 231 | 163.9 |
| Deep | 658 | 528.4 |
| Main flow | 327 | 313.6 |
| Basin | 384 | 320.2 |
| Total | 1,600 | 1,317.1 |
If the four do not add up, the base is wrong. Reconciliation is routine, not a pre-flood scramble.
The Skeleton
The menu structure follows the upper-level integrated platform: home, monitoring, forecasting, warning, rehearsal, plan. At first glance they look like six parallel modules; in use they are one timeline — watch the forecast as the river rises, warn as it nears the threshold, rehearse before deciding, execute the plan once the button is pressed, and monitor throughout. Drawn as six boxes, users treat them as six pages; drawn as a line, they know which one to open when.
Two pages sit outside the relay: the 3D models of the diversion and outlet sluices. They are the “see the site” entry used during rehearsal — gate opening sequence, flow behaviour, chamber structure — so that inundation results and gate structure are not crammed into one picture.
Home: One Map
A 1920×1080 wall: the area as one map, with the four zones tinted over terrain imagery; six station counts across the top; weather and structure stages on the left; profile, zones and evacuation roads on the right. It looks full, but it serves one question — if diversion starts now, how big is the extent and how many people are inside it.
 de-identified
The first version dropped hydrological, rain and camera icons straight onto the map. Two hundred and twenty icons covered the map and hid the inundation extent. The fix: stations move into monitoring and are plotted on demand; the home page keeps the counts. Counts answer “how much do we have”, the map answers “where does the water go”. Separated, both stay legible.
The profile gives four counties, 45 townships, 1,600 villages and 1.3171 million people; the zone panel gives villages and people per zone; the road panel gives 129 evacuation roads, 897.5 km and 75 bridges. The three interlock, so updating one forces a check on the other two — data governance built into the interface.
The home page also keeps a toolbox (distance, area, coordinates) and a layer switch. Distance is a high-frequency need in flood season: when the field reports “800 m east of that village”, measuring it on the map halves the conversation.
Monitoring
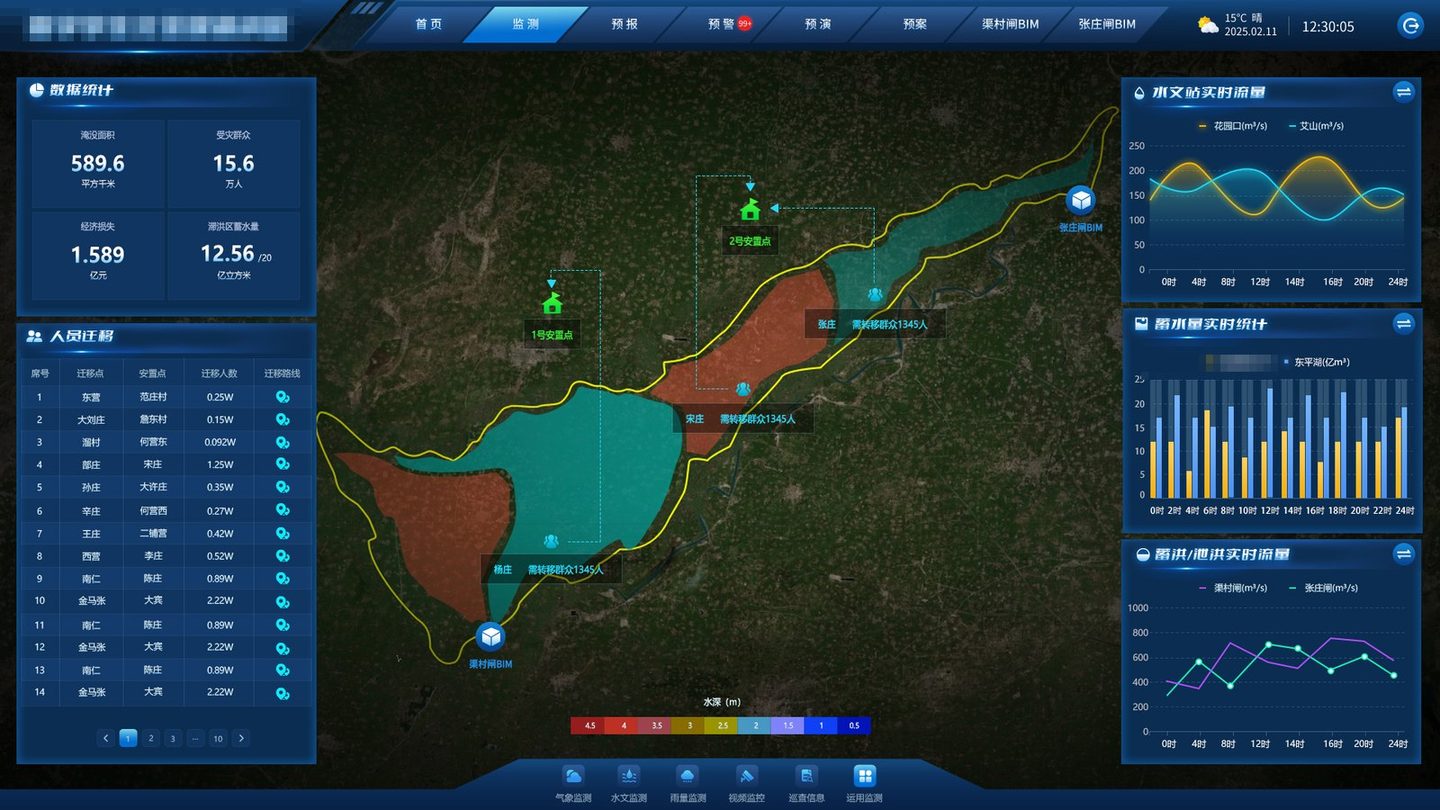
Four cards sit on top: inundated area, affected people, economic loss, stored volume. Below them, a fourteen-row evacuation ledger: origin, shelter, headcount, route. The top is “how much”; the bottom is “who”. Only the top is for briefings; both together are for the field.
 de-identified
A larger inundated area is not automatically worse.589.6 km² sounds alarming, but if the water sits mostly in the basin and deep zones the affected population can be far below a uniform estimate. Area must be read with zones.
Loss needs its basis stated.CNY 158.9 million at what unit price, including crops or not, counting shutdowns or not? If the card does not say, the review will argue. The basis is a configuration item.
Storage and area are not linear.1.256 billion m³ over 589.6 km² averages about two metres — but the deep zone may be five and the shallow zone under one. Averages mislead.
“2,500 people from that village” is useless on its own. The field needs the origin, the road, the shelter and the counterpart. The route column is what turns a number into an action.
All fourteen records locate on the map: origin, destination, connecting line. Shelters share one icon, and shelters 1 and 2 stay pinned so nobody has to ask which one still has space.
Forecasting
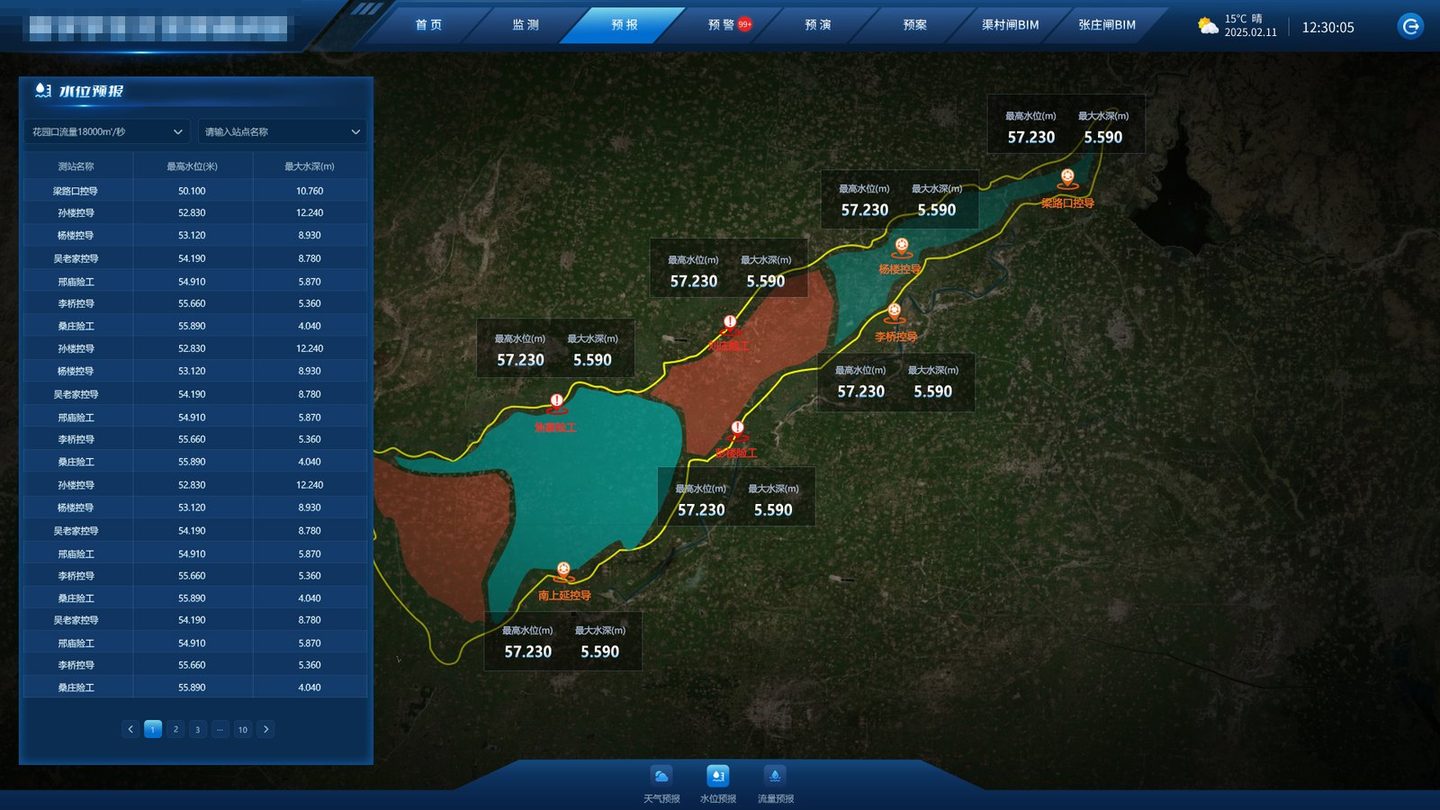
A hydrologist says “18,000 at the control station”, and the field hears a number; the village head wants to know where the water stops. The whole job of the forecasting page is to translate discharge into stage and stage into inundation. The translation comes from two places: the stage–discharge relation at each section, and the plans written per discharge level.
 de-identified
| Upstream discharge level | Stage at the four gauging stations | What the platform prompts |
|---|---|---|
| 5,000–10,000 m³/s | Below warning; stages rising section by section | Denser monitoring; no evacuation |
| 10,000–15,000 m³/s | Approaching warning level | Yellow: preparation |
| 15,000–20,000 m³/s | Some sections above warning | Orange: evacuation and clearance |
| 20,000–22,000 m³/s and above | Near the guaranteed stage | Red: detention-area operation; move into rehearsal |
22,000 m³/s is the design flood standard of the lower Yellow River levees, and the key node for whether a detention area has to be used: only when reservoir regulation and existing flood-diversion works still cannot keep the downstream within safe discharge does the operating procedure begin. The platform turns that judgement into an option instead of a number to memorise.
Warning
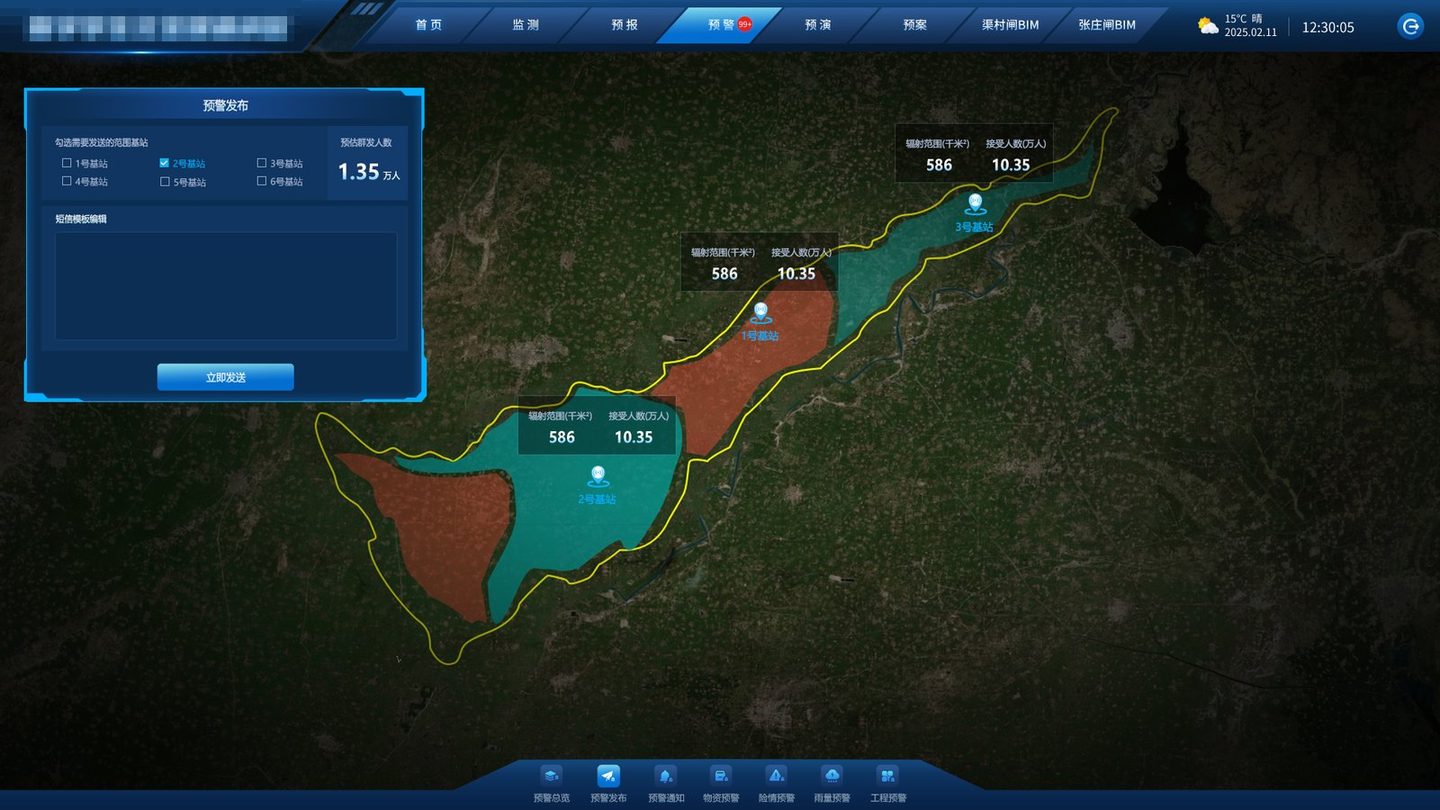
Three levels map to three stages of action: yellow is preparation, orange is evacuation and clearance, red is operation. The level is not decoration; it decides who moves and when. The hard part is the last mile: reaching people who have installed nothing.
 de-identified
Rehearsal
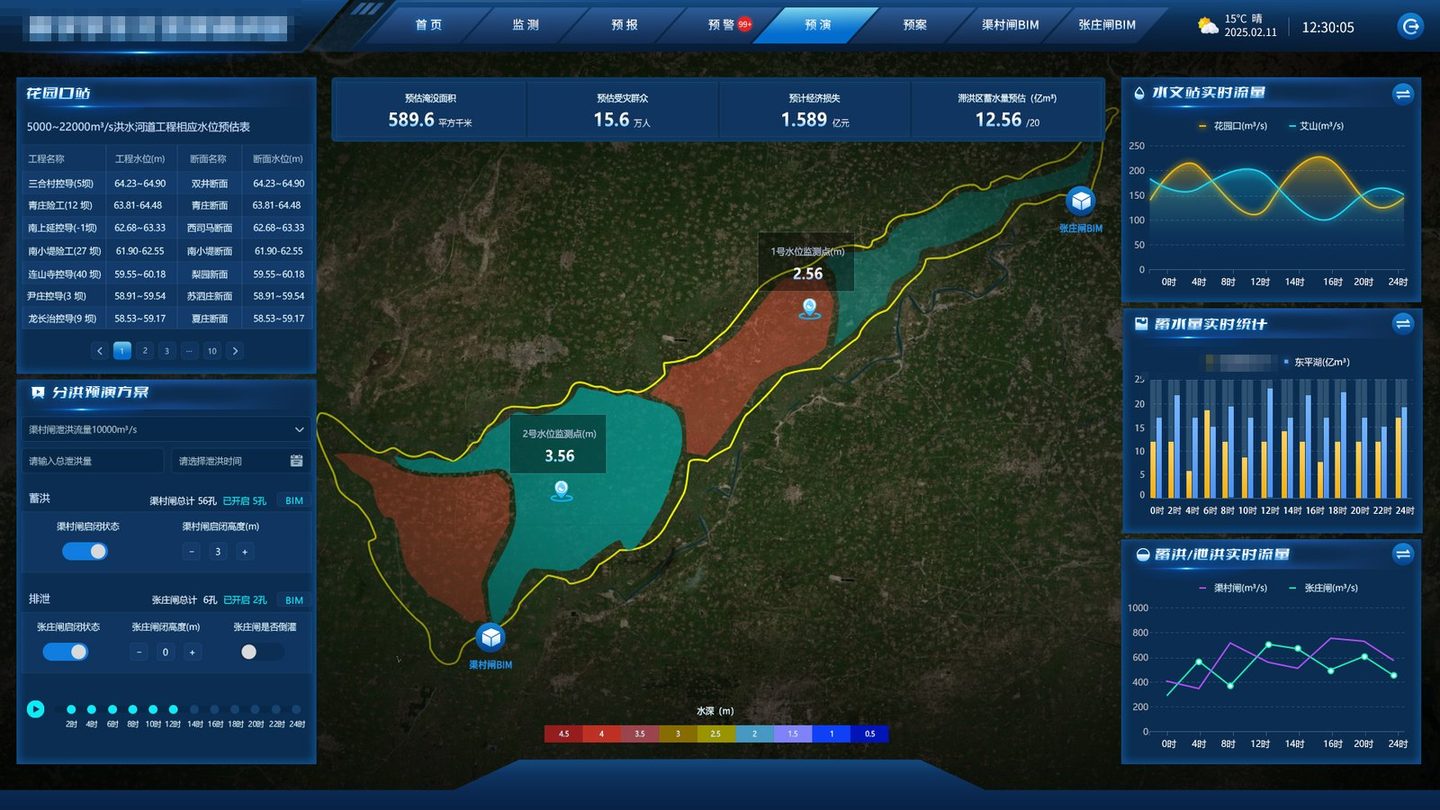
The left side is a set of parameters: diversion flow, duration, number of gates and opening height on the diversion sluice, the same for the six outlet gates, and whether backflow is allowed. The right side is four results: inundated area, affected people, economic loss, stored volume. Parameters are “how the water is released”, results are “what happens next”; the model sits in between.
 de-identified
A rehearsal result is not a forecast; it is a run under given parameters. Every result card carries its parameter snapshot, so a second run is a second snapshot — and two side by side are a scenario comparison. That is why the rehearsal has to be adjustable: a fixed run cannot support the decision of which option to choose.
Response Plan
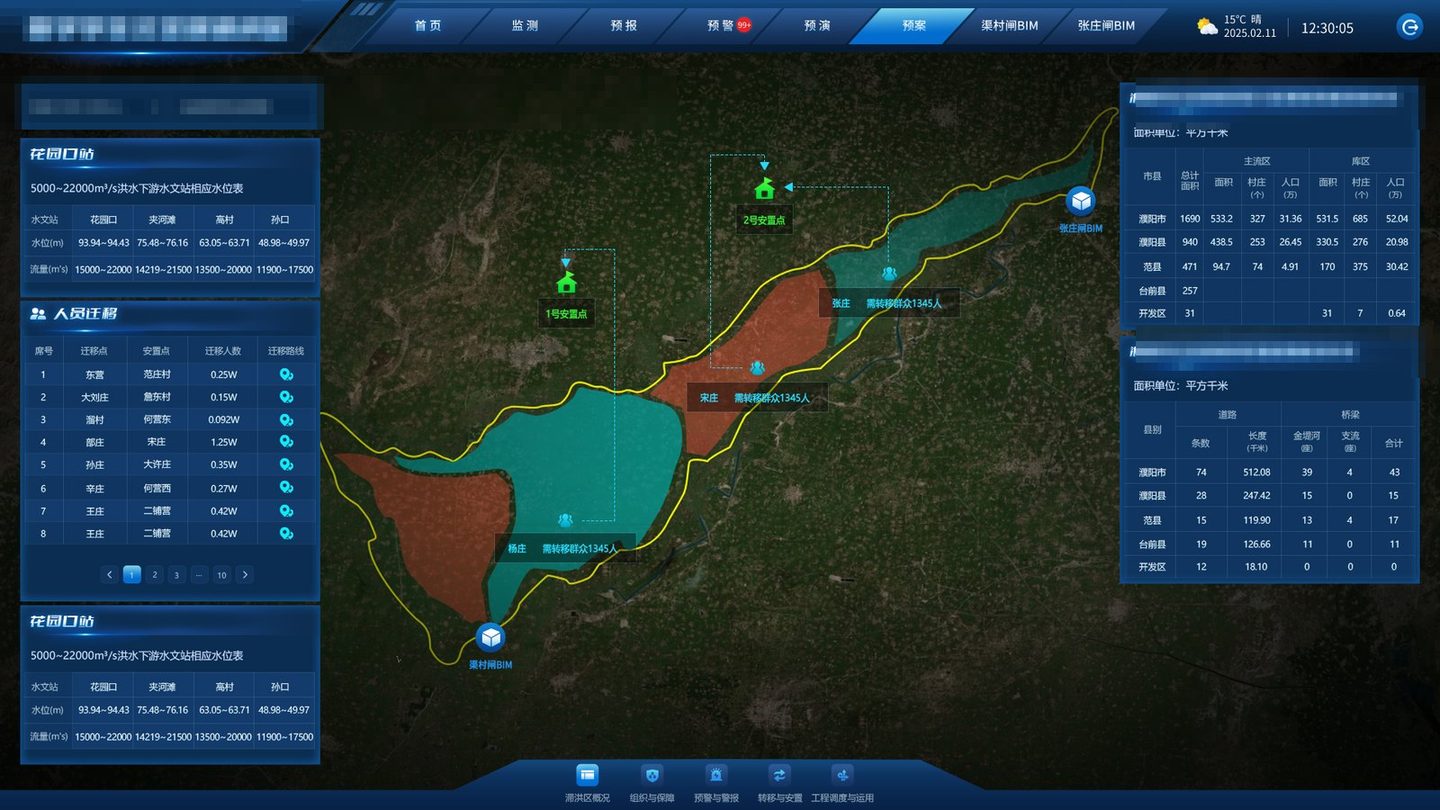
The paper plan is not badly written; it is hard to find things in when you need them. The platform organises five blocks: area profile, organisation and support, warning and alarm, evacuation and shelter, sluice operation. Each block maps to one action on site, not to a chapter in a document.
 de-identified
One easily missed design: the plan page is selected by discharge level. The same screen at 15,000–20,000 and at 20,000-plus produces different evacuation scale, road closures and shelter counts. A plan is not a document; it is a set of branches triggered by conditions.
Iteration
Within one month of kick-off the operating authority filed 20 change requests, all marked urgent: ten on the home page, one on monitoring, one on forecasting, three on warning, one on the plan, one on rehearsal and two for the sluice models. This is not rework; it is requirements converging against real data. Read the 20 and the current design explains itself.
| Where the changes concentrated | Typical item | The real need behind it |
|---|---|---|
| Home page (10) | Add detailed geometry to the boundary and draw it blue; default to the four upstream stations; move station icons to monitoring | The home page is not “everything”; it is boundary plus four key stations first |
| Home interactions (4) | Profile, zones, structure stages and road statistics must all “interact with the map once data arrives” | Every panel has to point back to the map; no dead images |
| Monitoring / forecasting (2) | Follow the floodplain platform’s layers and plotting; align the forecast page’s five modules | The upper-level platform is the house style; the language must match |
| Warning (3) | Supplies warning to the materials platform; hazard warning from smart sensors; a new alarm button | Warning is not rain alone; it covers supplies and structural hazards |
| 3D models (2) | Diversion sluice by 27 April, outlet sluice by 10 May | Rehearsal must “see the gates”; the models are hard milestones |
The communication list holds 13 unresolved items: map elevation accuracy and data format, model level for the sluices (down to parts?), oblique photography versus design models, which rivers to display, who supplies the two expressways and village data, which system provides structure records, the sensor inventory, the coverage of weather forecasts, services versus WebAPI, deployment at the provincial platform or locally, who provides the inundation model, and whether a test environment exists.
These are boundary questions, not technical ones. Unclear boundaries can waste any amount of work. Our approach: list them, build what does not depend on them (skeleton, interaction, presentation, parameter configuration), make dependencies configurable, and wire them when data lands.
The platform has six menus and dozens of screens, but the hardest and most memorable are the two 3D sluice pages: opening sequence, flow behaviour, chamber structure. Doing them first buys three things: it proves the 3D pipeline and performance, it gives decision-makers a visible anchor of trust, and it forces the data owners to hand over models and drawings early.
It is the same order we use on industrial and water projects: take the hardest block first, never leave the risk to the last week.
One honest note: acceptance for this kind of platform is rarely “every line ticked”. It is whether, during a pre-flood drill, the duty officer can find the map, the person and the gate he needs within three minutes. So before handover we run a “find it” test, not just a feature demo.
Delivery & FAQ
Delivery covers the platform, data integration, the two sluice model pages, deployment and training, plus a maintainable statement of data definitions. The definitions matter more than the code: where each number comes from, how often it updates, and who owns it.
MORE CASES
An auxiliary decision platform for a flood detention area on the lower Yellow River: four counties, ...
View Details →
An integrated energy platform for an aviation-base campus, delivered as a 3D digital twin plus a 2D ...
View Details →
A bird-hazard platform for a regional grid operator's transmission maintenance team, delivered as a ...
View Details →Start with our pricing logic, then let's talk requirements — cost structure, technology comparison and acceptance criteria, all laid out in the open.