
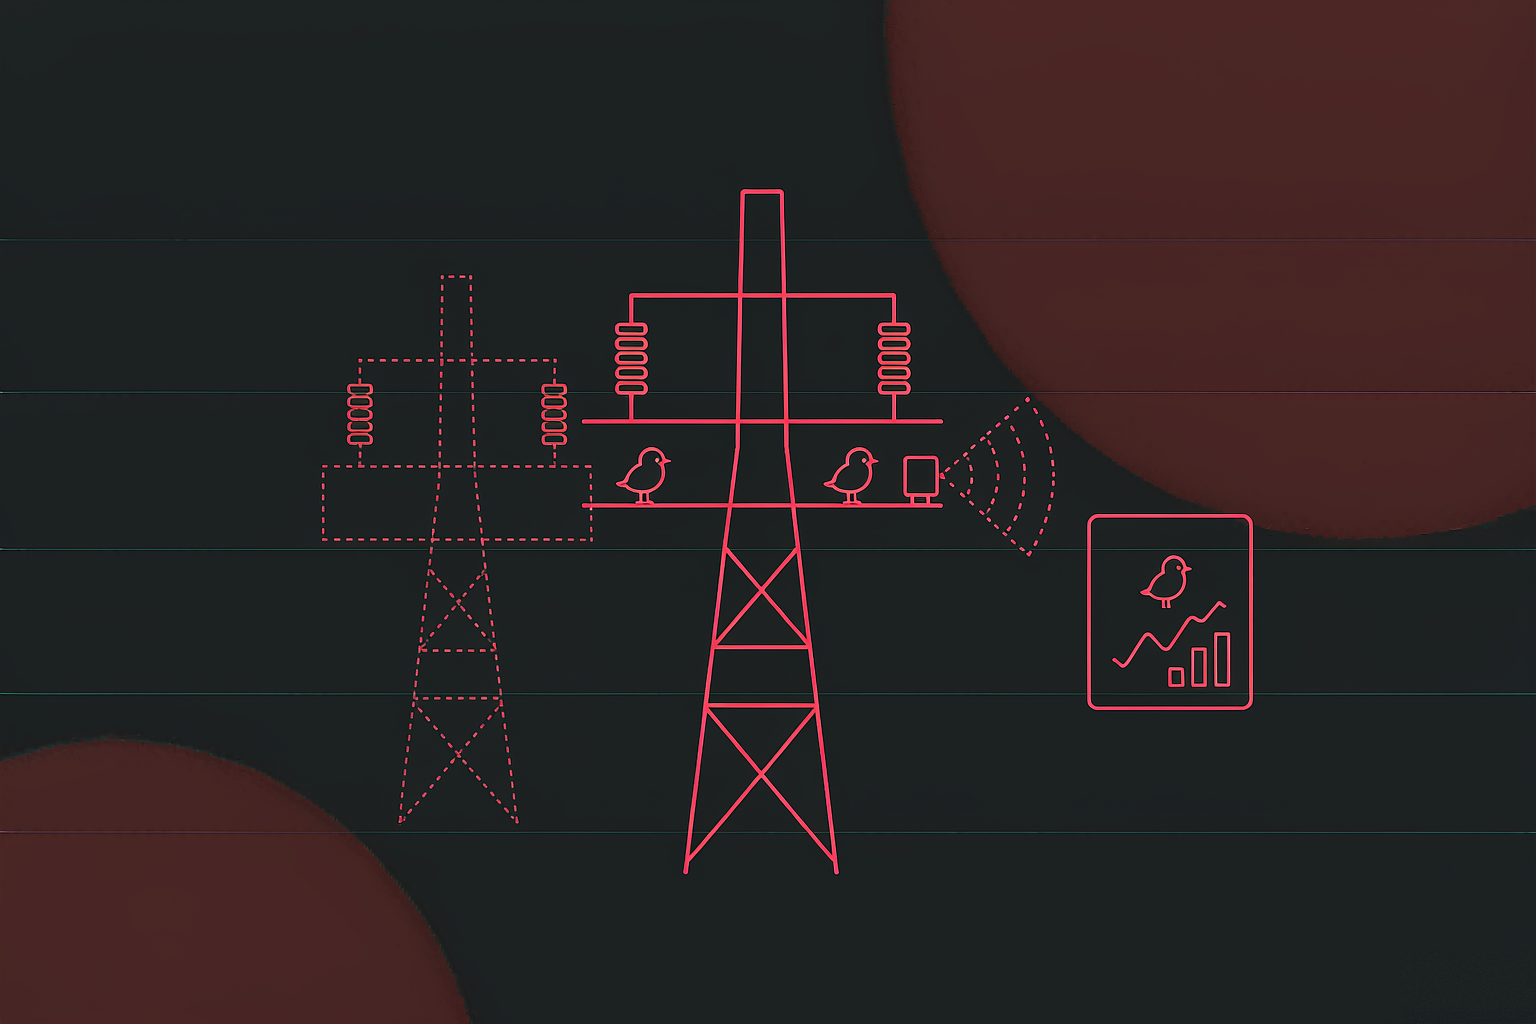
Digital-twin bird-repellent system
A bird-hazard platform for a regional grid operator's transmission maintenance team, delivered as a ...
View Details →The Problem
The most common public question is why a bird can sit on a high-voltage conductor unharmed. The answer is simple: two points on the same conductor sit at the same potential, so there is no circuit. What causes outages is everything the bird does besides perching. Separate the four mechanisms and you know when, against which bird and with which tool a repellent device should act.
A bird excretes from an insulator or crossarm; the wet streamer bridges the live conductor and the earthed crossarm, or forms a conductive path along the insulator surface, and it flashes over. Public industry reporting puts excrement-related faults at roughly 80% of bird-related outages, with the probability rising sharply in fog, drizzle and high humidity — which is why rainfall and humidity sit in the first row of the weather card.
Magpies and crows prefer stable towers, and their nests often contain wire and wet twigs. A nest spanning two phases, or conductive material dropping between a live part and the steel, causes a phase-to-phase or earth fault. Wet nests conduct better, so nest clearing before the rainy season is a fixed maintenance task.
The Oriental stork is nearly a metre long with a much wider wingspan. Taking off, landing or spreading its wings, it can touch two conductors at different potentials, or a conductor and the tower, and become the circuit. These faults often injure or kill the bird, which is the real origin of the phrase "repelling birds is protecting birds".
Some species peck insulators and composite parts. A single peck shows nothing; accumulated damage degrades insulation and creates a latent defect. This does not appear as a sudden outage but in equipment life and maintenance planning, and is found through inspection and image comparison.
Sources: public industry reporting and commentary on DL/T 1570–2016, the Chinese standard for bird-hazard risk grading and distribution mapping. Figures describe the problem, not measurements from this project.
The Local Constraint
The build is labelled a Huai'an-specific edition, and that is not a skin with a different place name. Huai'an sits in the lower Lixiahe plain by Hongze Lake: dense waterways, continuous wetlands, and a major stopover on the migratory flyway. The birds are numerous and many are protected, so the system has to work by zone, by time window and by method — not by one switch that turns everything on.
Hongze Lake wetland hosts more than 200 bird species; the nature reserve has recorded 245, and close to a million migratory birds winter here each year. Device density and bird complexity both exceed what foot patrols can cover.
A national first-class protected species with a global population under 10,000, nicknamed the giant panda of birds. It prefers to nest high, and suitable trees are scarce in the wetland, so transmission towers become the first choice — here the bird and the line are the same problem.
The publicly described local practice divides the area into three zones: the core reserve bans acoustic and light repellents and uses insulated covers and artificial nests; the buffer zone combines sound and light; only the general zone uses the full toolset. A system must be configurable per zone.
At 1,500 towers, a vehicle-and-eyes round takes weeks. The system surfaces the three questions that matter today — which towers have birds, which devices are offline, which strategies fell below 90% coverage — so inspection follows signals instead of a fixed route.
Arrivals, repels, success rate and exception closure can be pulled by county, by circuit and by month. Reporting upwards no longer stops at "how many units", but answers how many arrived, how many were repelled and how much risk remains in this district this month.
Architecture
The usual mistake in this kind of system is treating the data wall as the whole product. The wall is only the outer skin; underneath it need device ingest, a strategy engine, video and AI, and an alarm workflow. Devices, protocols and camera vendors are never uniform — that integration is where the real engineering sits.
A site may run three or four brands of repellent units and two or three camera brands. Keeping protocol differences inside the ingest layer means upper layers only see "device ID, capability set, parameter table", and replacing hardware does not touch a page.
A strategy is not a switch on a screen but a rule: under which condition, do what. On the server it can link neighbouring towers, respect a time window, and be audited — who changed what, and when.
An operator is not there to read reports but to find out what to handle now. The wall orders information as alarms, strategy gaps, offline devices, trends, then history — and that order decides the layout.
Screen Layout
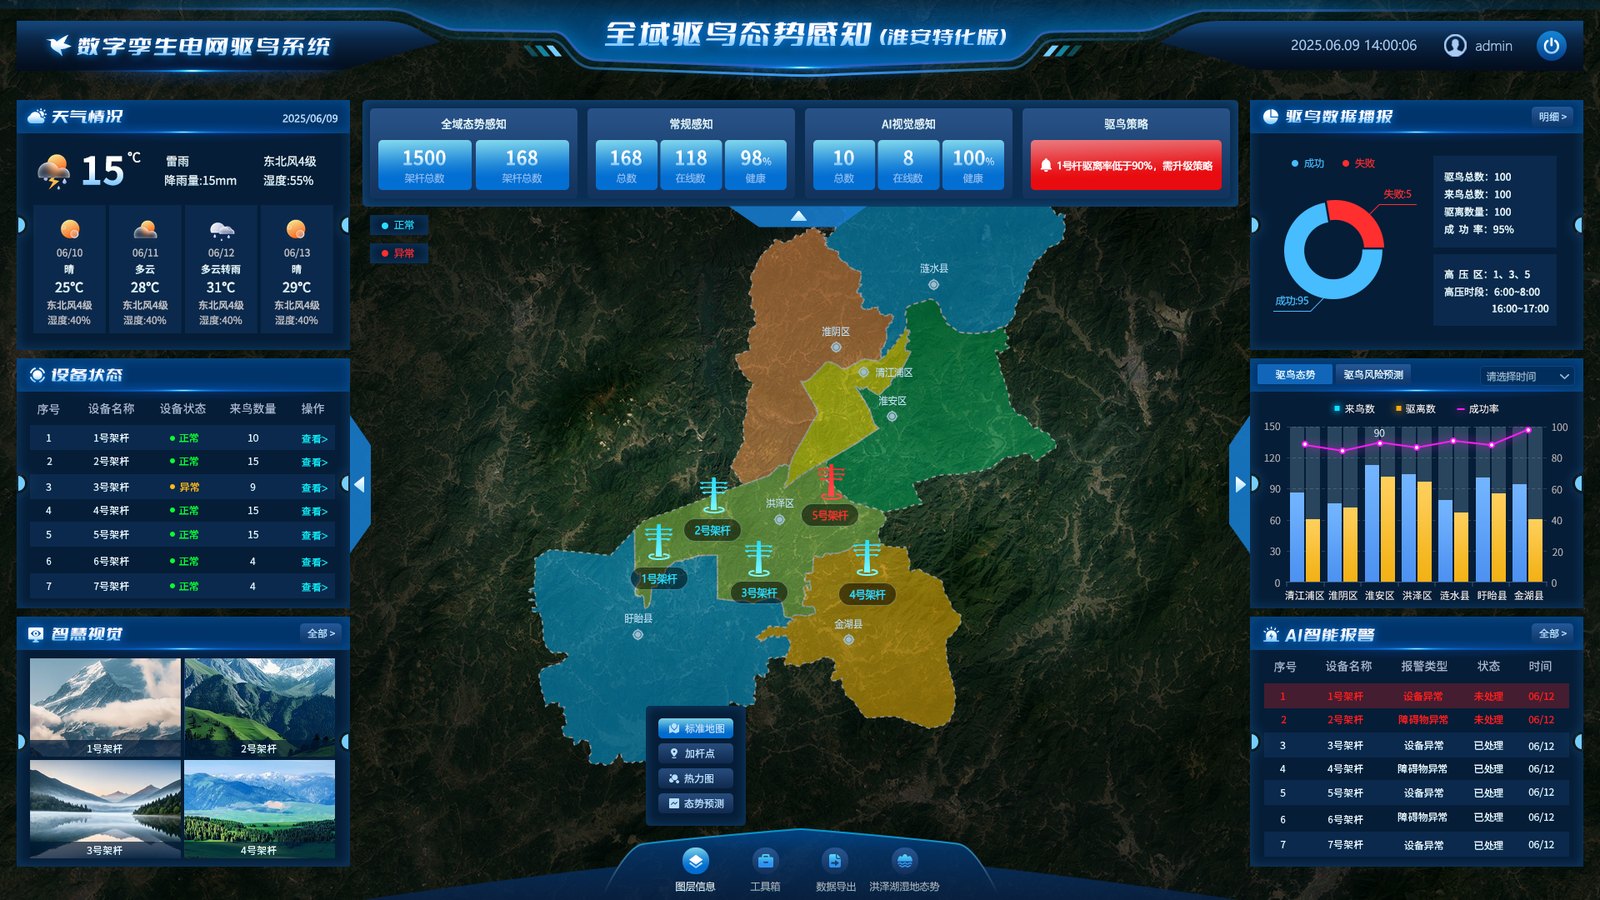
More than forty information points have to fit a 1920×1080 screen. The answer is not density but a fixed reading path: left answers "are the environment and the devices healthy", centre answers "where are the birds and the risk", right answers "what do the numbers say and what needs handling". Three questions, three columns, nothing to hunt for.
1,500 is the tower register that defines scope and responsibility; 168 is the number of installed repellent points, of which 118 are online and 98 healthy. Scope alone suggests full coverage; online counts alone hide the gap. Placed together, the shortfall is visible — which is why the strategy card raises its own alarm when 18 towers fall below 90% coverage.
On a dark wall the eye lands on the central map first, then sweeps sideways. The alarm feed sits bottom right because it needs to be scanned, not to shout: genuinely urgent events pop up and push to mobile. A fixed position, a rolling list and red for open items beat a blinking screen, and avoid alarm fatigue.
The base map answers "where", markers answer "which device", the heat map answers "where are the birds", and the forecast layer answers "what happens next". Four layers for four questions; switching is cheaper than stacking everything, which usually means nothing is legible.
Bird behaviour tracks weather: rain, humidity, visibility and wind change both perching and flight, and they change how well laser and acoustics work. Weather sits top left so the operator knows what kind of day it is before reading any number.
One Tower
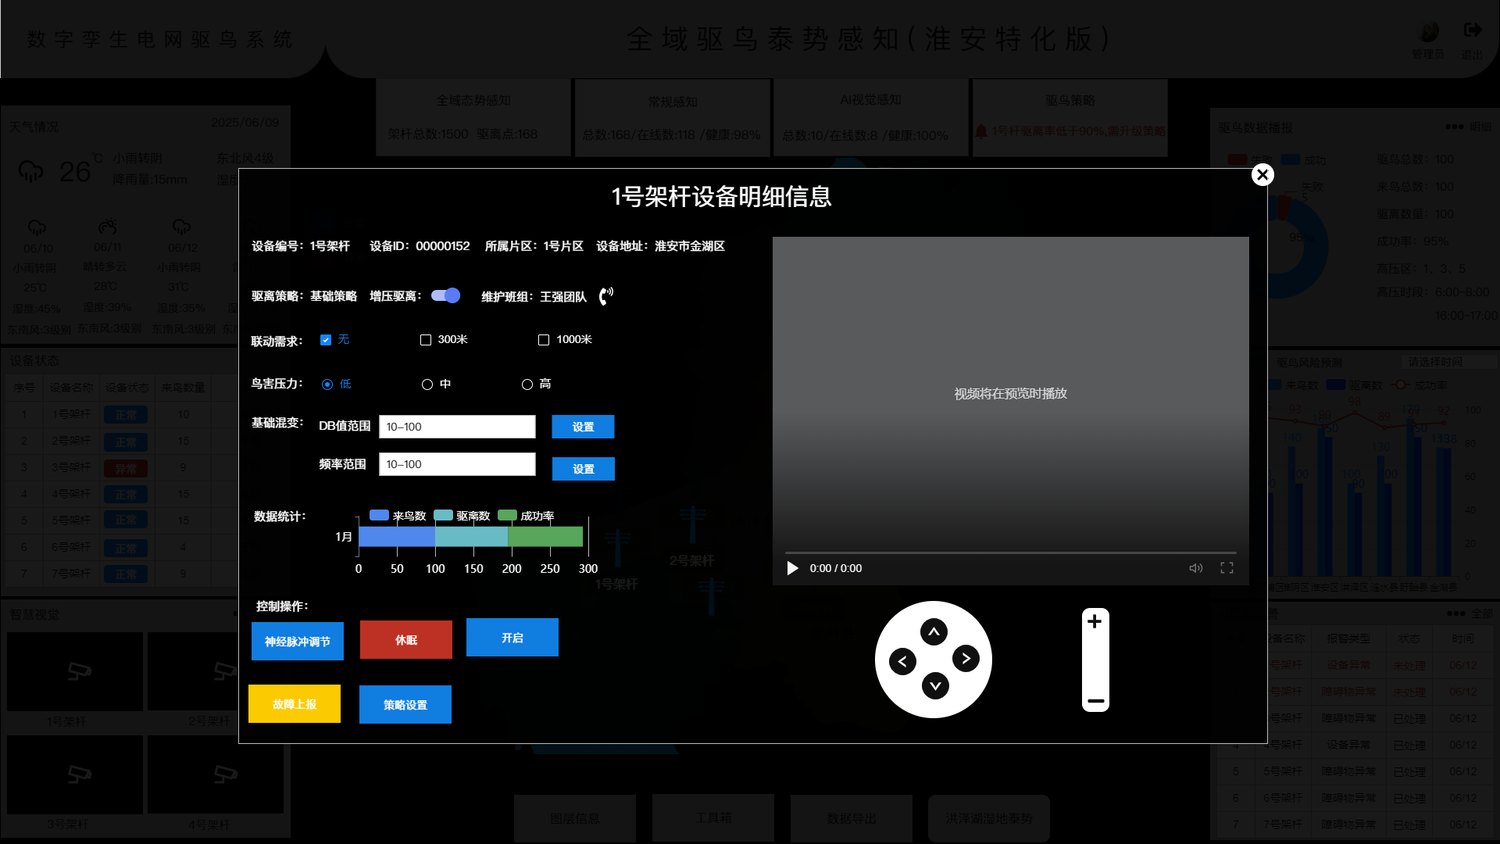
The wall answers "how is the area doing"; the panel answers "what do we do about this one". Click a marker and the full site appears: which circuit it sits on, who maintains it, what strategy it runs, what went wrong before, and what the camera sees right now. This is where maintenance work actually happens.
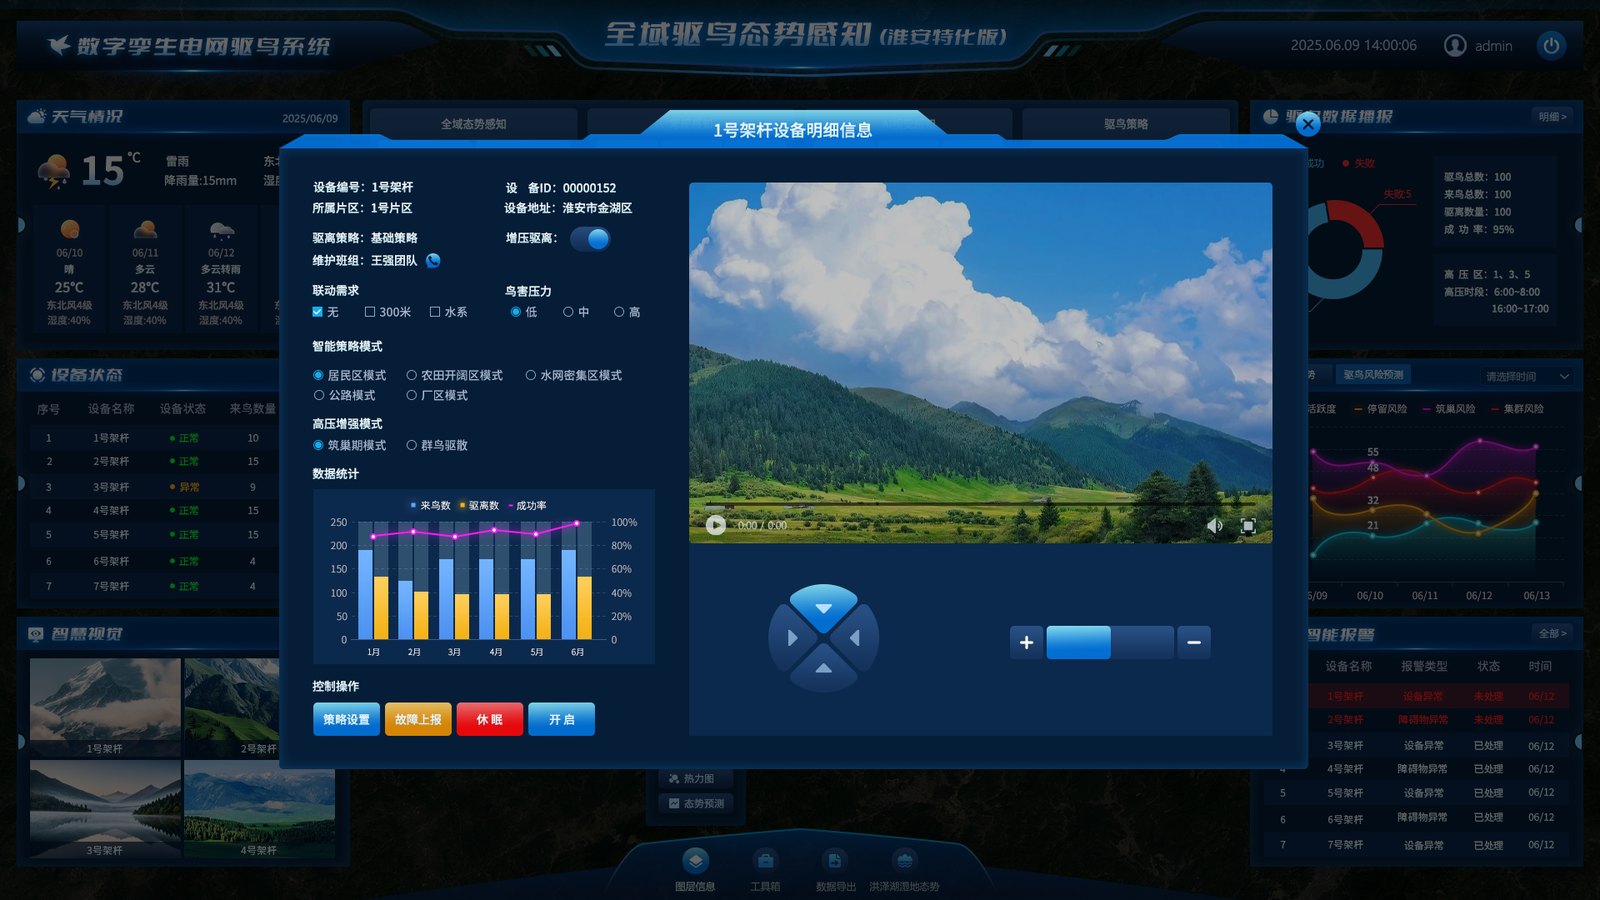
None of these fields are decorative. Each answers a question that comes up on site: who to call, whether a parameter was changed, whether linkage fired, how heavy the bird pressure is here.
| Field | Example | Why it must exist |
|---|---|---|
| Device number / ID | Tower 1 / 00000152 | The number is what crews say on site, the ID is the system key. Tickets, alarms and repair history all align on it. |
| District / address | District 1 / Jinhu, Huai'an | Decides who responds, which county figures it lands in, and which protection zone applies. |
| Circuit | 500 kV line #3 | Bird-hazard accountability and outage impact are both counted per circuit. |
| Maintenance crew / contact | Crew Wang / one-tap call | An alarm is useless without a person, and it has to be this tower's owner, not a general duty line. |
| Strategy / boost | Base strategy / on | Base is the norm; boost is a temporary step-up for a heavy period. Kept separate so it can be rolled back. |
| Linkage radius | None / 300 m / 1,000 m | One unit covers little. Neighbouring towers acting together create a repellent band. |
| Bird pressure | Low / medium / high | A human-assigned risk level for the section; drives thresholds and inspection frequency. |
| dB range / frequency range | 10–100 / 10–100 | Intensity and band of the acoustic output. This is a recipe, not a volume knob, because birds adapt to a fixed band. |
| Pulse rate | per minute | Sets the rhythm of stimulation. Too dense speeds up adaptation; too sparse never disturbs. |
Who changed it — operator, time and IP go to the log. What it became — a parameter snapshot is pushed, not "a switch was flipped". Whether the device agreed — the platform reads the value back after the command and shows the reported value, not the typed one.
These look like back-office details, but they decide whether crews can trust the system. Without read-back, "on" may only mean "the command left"; without a log, nobody can say who enabled sound and light in the core zone, or when.
Strategy
The same unit does entirely different work in different places. Beside a paddy it deters birds after the grain; beside a highway the beam must not distract drivers; on an industrial site it has to protect people as well as equipment. So the system makes the mode selectable, the intensity a range, and the timing a condition — not one on/off switch.
| Mode | Typical siting | Strategy | Main constraint |
|---|---|---|---|
| Bird zone | Wetland edges, flyways, dense tower sections | Repel-first: wide sweep, sensitive triggering, stronger at dawn and dusk | Core reserve needs lower intensity or physical protection instead |
| Open farmland | Paddies, wheat fields, aquaculture ponds | Follow the farming calendar: denser at sowing and harvest, low-level otherwise | Must not interfere with farm work or people |
| Closed paddy | Continuous paddy, controlled-water polder areas | Linked to water level and the farming cycle, closed-loop, fewer wasted triggers | Requires alignment with local farming schedules |
| Highway | Line crossings, ramps, bridge sections | Limit beam height and angle, keep it out of the driver's field of view | Must not distract drivers |
| Industrial site | Substation surroundings, parks, warehouses | Protect people and equipment, define no-beam zones, lower power at night | Dense human activity; needs interlocks and signage |
Mode names come from the delivery build; parameter ranges are calibrated on site and are not published here.
Louder is not better. Excessive sound pressure invites complaints and speeds up adaptation. The system pushes a range (for example 10–100) and the device varies within it, so one intensity is never repeated long enough to become background.
Species differ in sensitivity, and a fixed band stops working within weeks. An adjustable range keeps the stimulus irregular — the industry's standard way of delaying habituation.
Measured per minute. Dense while a bird is settling, lower once it moves off. This is the most "feel"-dependent parameter, so crews tune it per device on site rather than applying a global value.
One unit has a limited reach, and a bird driven off often just moves to the next tower. A linkage radius makes neighbouring towers act together, forming a repellent band. 300 m suits closely spaced towers in general zones; 1,000 m suits open flyway sections. Too wide a radius has a cost: a false trigger sets off a whole row and becomes a nuisance.
The strategy card does not count devices; it counts how many towers fall below 90% strategy coverage — the share of required hours in which the strategy actually ran. A device that is online but running the wrong strategy is not installed in any useful sense. That line separates "fitted" from "working".
Alert Loop
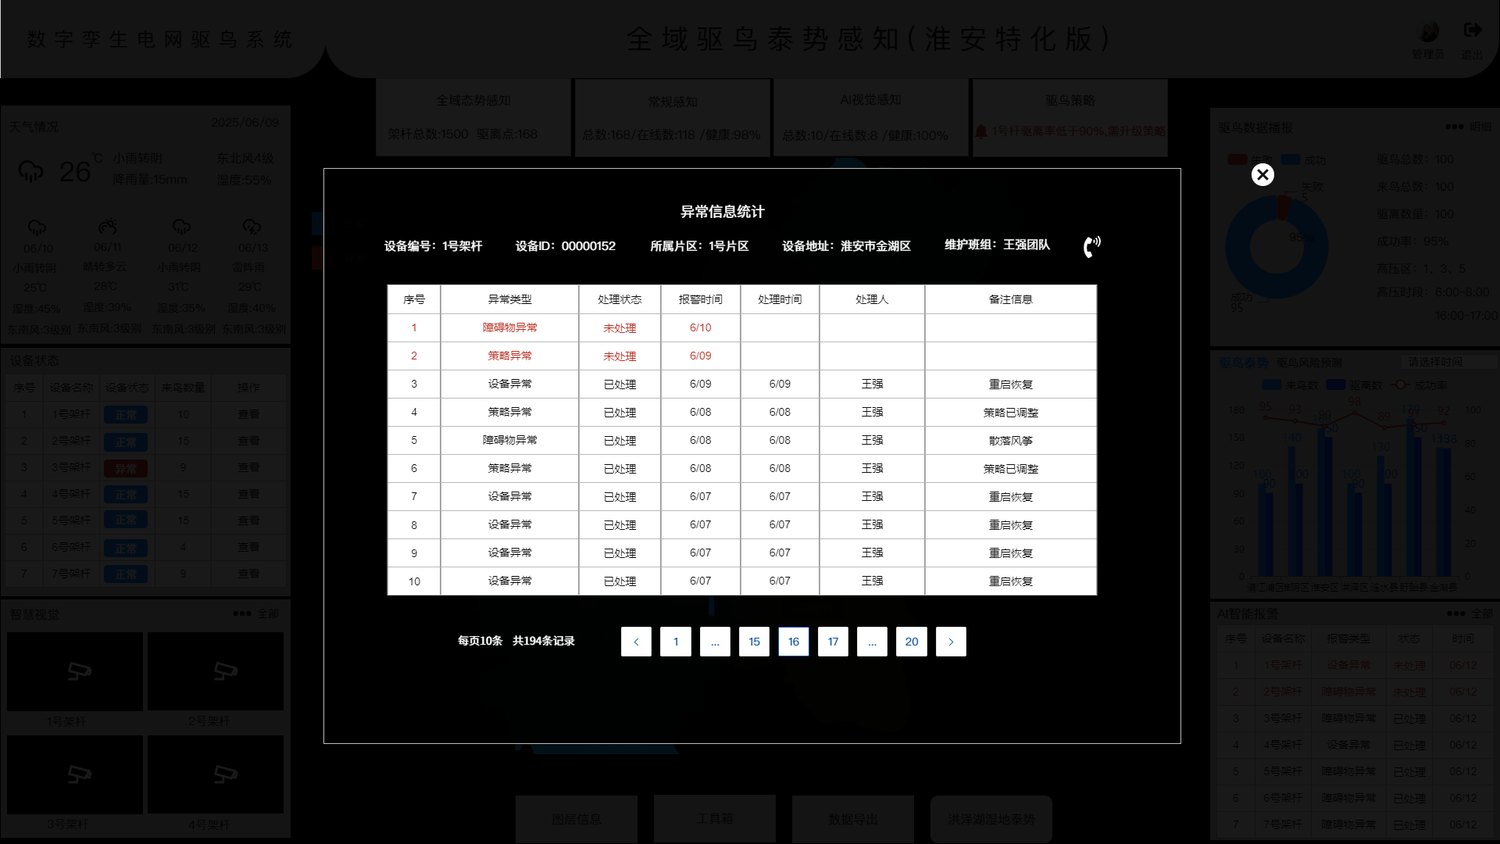
With many devices, the risk is not too few alarms but too many to read. Each exception becomes one traceable row: what type, what state, when it fired, who handled it, how. One row, one small closed loop.
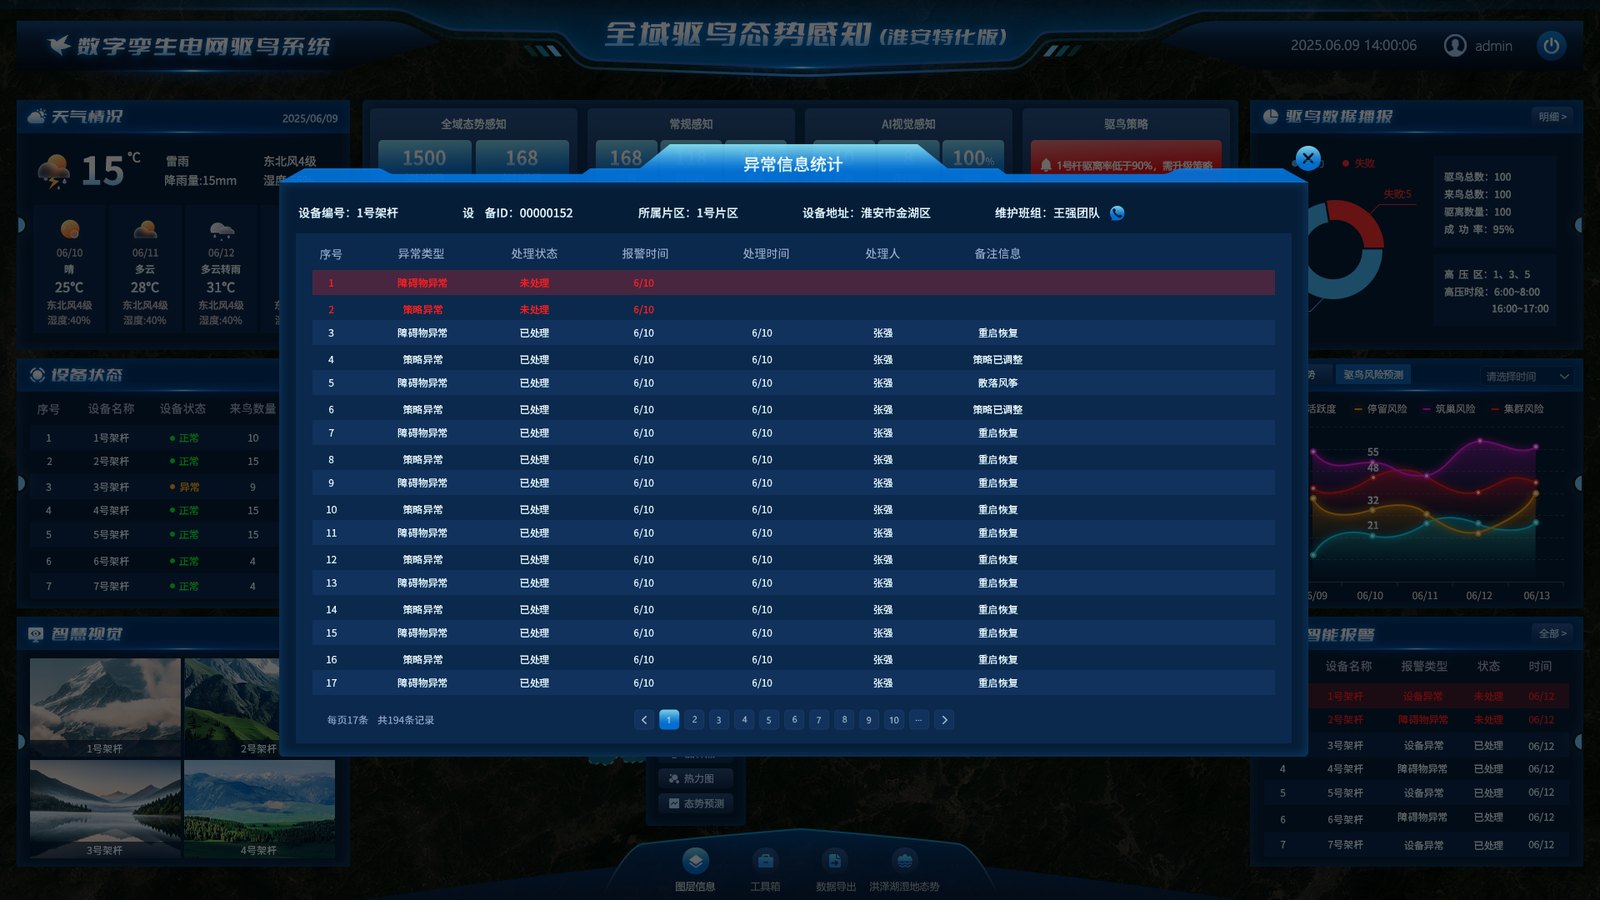
Obstruction: something that affects safety appears in frame — a flock, debris, machinery — and video review decides between repelling and dispatch. Device fault: the unit itself is failing, offline or losing power, so it becomes a repair ticket. Lidar fault: the detection unit misfires or sees nothing, usually calibration or obstruction. All three share one table; the type column routes them.
Remarks seen in the delivery build include lidar, device alarm, false target, recovered after restart, strategy adjusted, fault cleared. Those few words separate an alarm from a fact: a real bird event, a failing device, or a model that misread the scene. Without that column, 194 records are just 194 red dots.
Numbers That Matter
Bird data is easy to turn into charts that look busy. This build keeps only what can guide an action: arrivals, repels, success rate, plus a county-by-county comparison. The four risk forecasts answer not "how was yesterday" but "where do we send people tomorrow".
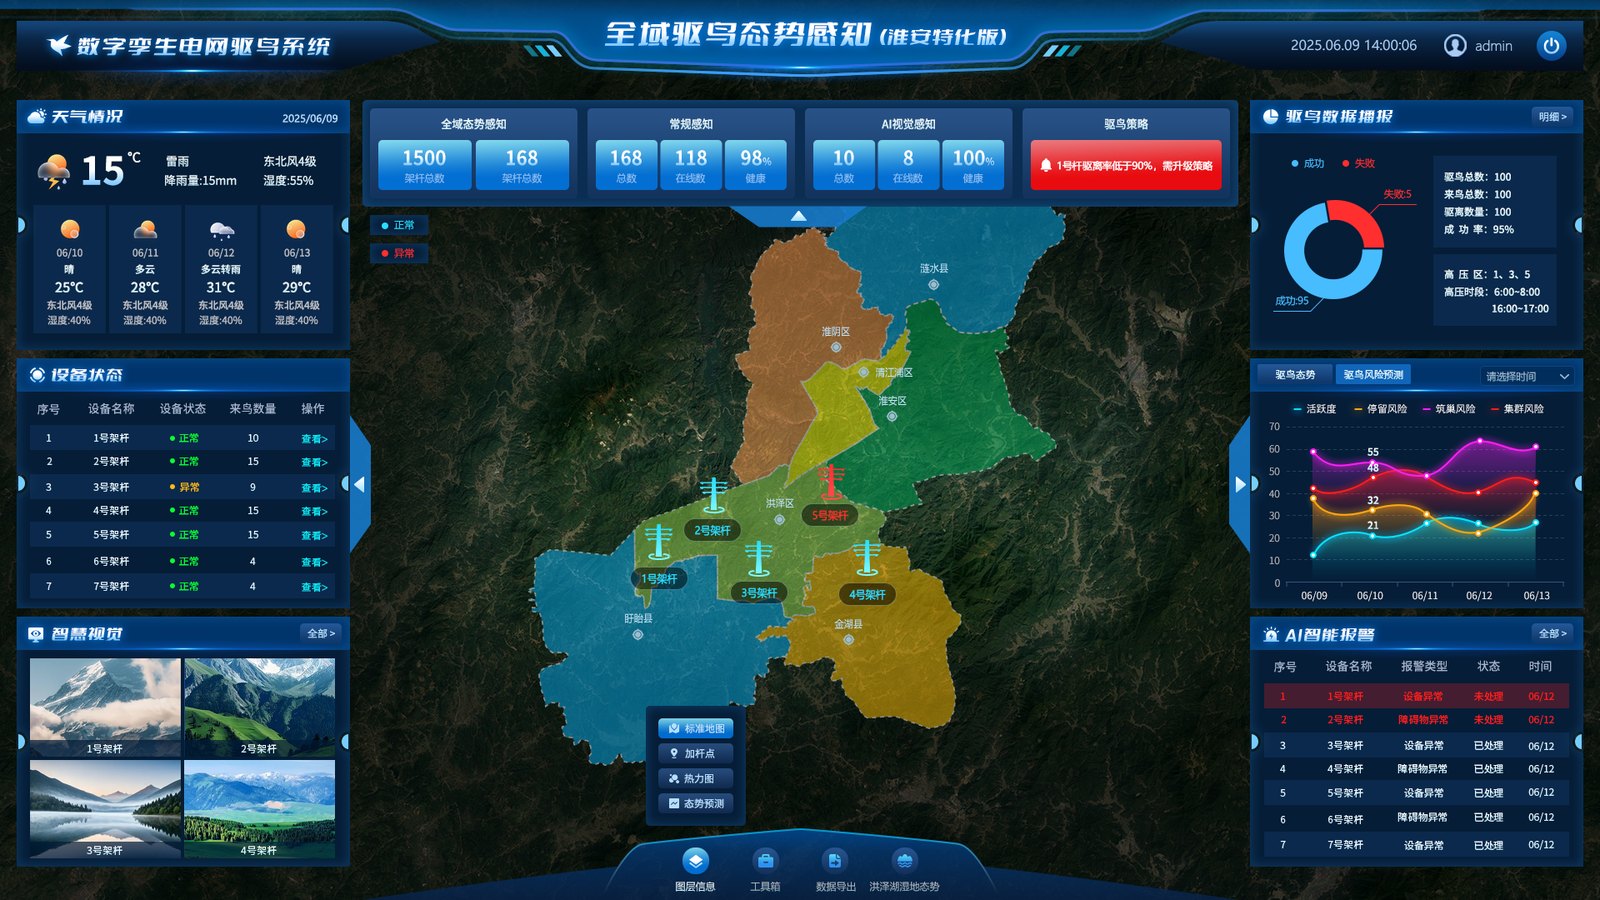
Success rate is repels divided by arrivals, and it is easy to inflate: count a false alarm as a repel, or an unconfirmed target as an arrival, and the number looks excellent. The three figures therefore always appear together, and they must reconcile with the "false target" remarks in the register. A lone 95% explains nothing.
These are not voltage levels but repellent intensity steps. 1 maintains, 3 steps up, 5 is the strongest, matched to bird pressure and protection requirements. Steps make accountability explicit: a core reserve can be pinned at 1, or left to physical protection only, instead of being swept up by a default "everything on".
Activity high → inspect more often. Perching risk high → check whether repellent units are online. Nesting risk high → schedule nest clearing and baffles. Flocking risk high → start linked repelling and notify the district. Four indicators, four responses — not four decorative curves.
Urban circuits are read as a corridor: repels, pressure points and windows by county and section. The wetland is read as an area: east bank, west bank and a five-kilometre band. Two spatial conventions coexist because the managing bodies and the performance measures differ.
Mobile
The wall lives in the control room; people live in the field. The app is not the wall squeezed onto a phone. It keeps only the four things that matter on site: which towers need a strategy change today, which device is faulty, what the weather is doing here, and whether an alarm has been handled. All control stays on the desktop.
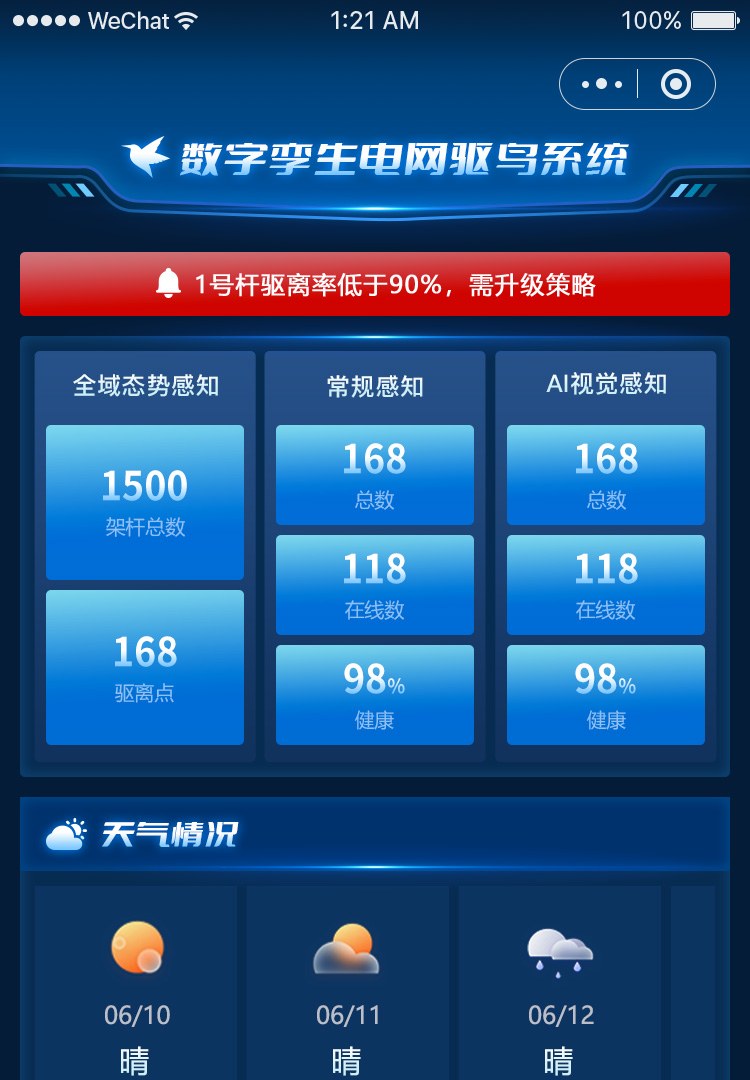
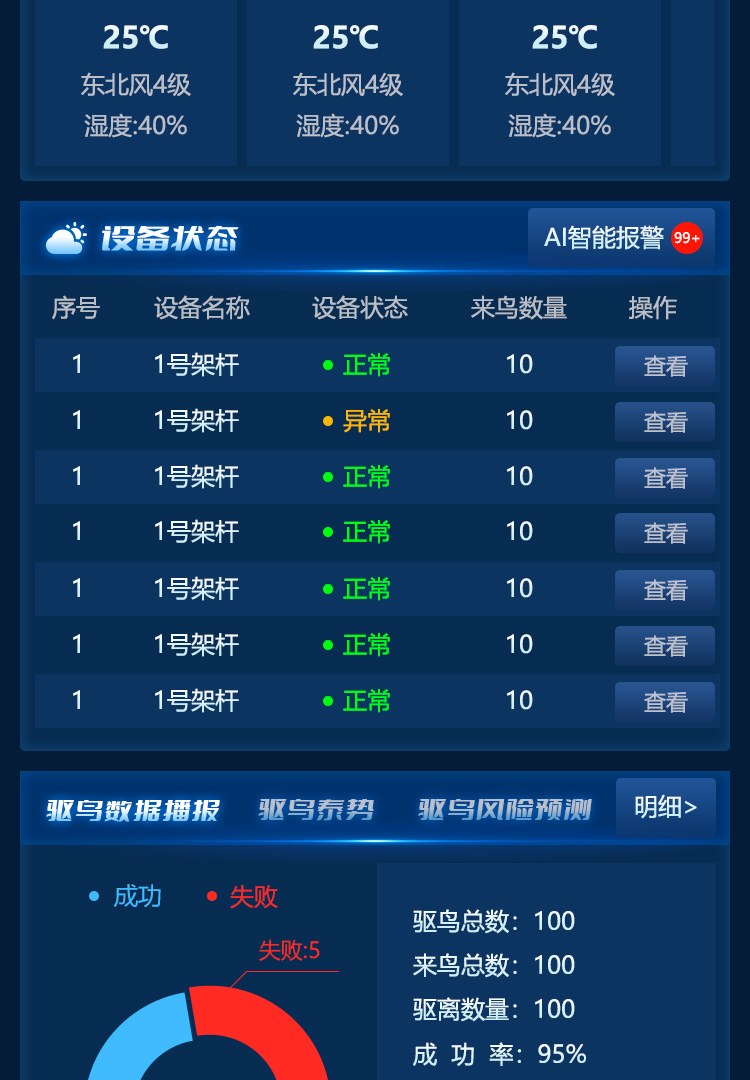
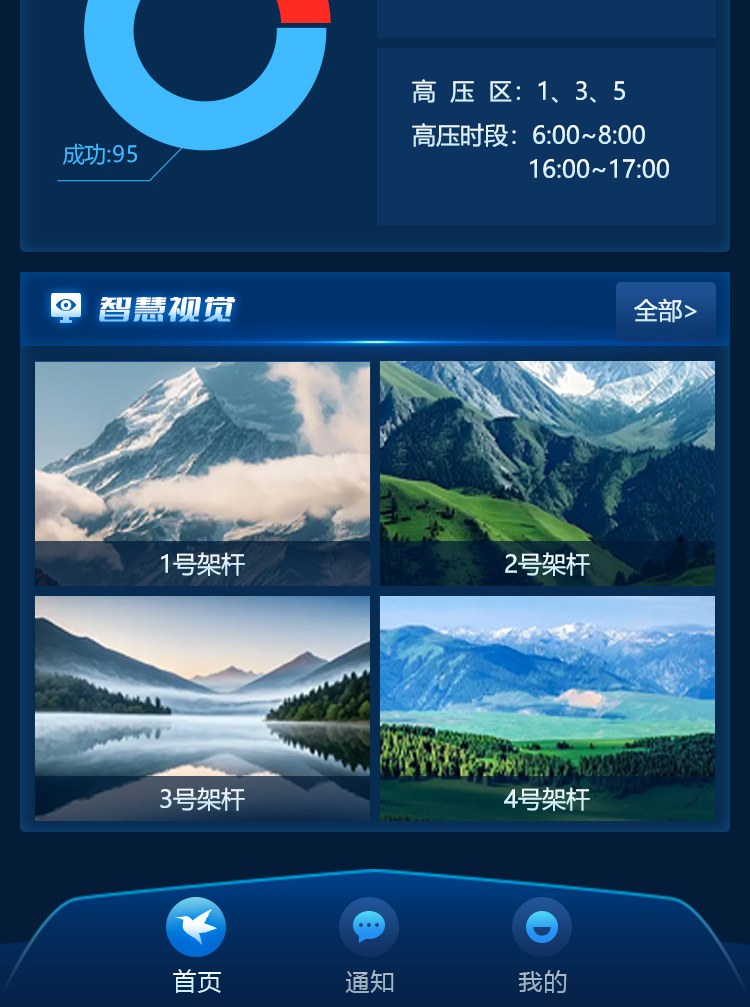
The mobile home screen is cut into three segments top to bottom (demo data). The strategy warning sits at the very top: the only red banner expanded by default.
The first screen has limited space, and whatever sits first becomes "today's most important thing". Towers below 90% coverage are the gap that must be closed today, ahead of any statistic.
Home, notifications, account. Field staff do not manage registers, edit roles or export reports from a phone — that is office work. Fewer tabs means fewer mis-taps with one hand and gloves on.
Starting a laser, changing intensity or putting a unit to sleep touches personal and equipment safety, and needs permission checks, a second confirmation and an audit trail. That is hard to do well on a small screen, so it is not offered. One fewer entry point, one fewer class of incident.
Screens & Design Process
Projects like this start as grey wireframes that settle information hierarchy, then move to visuals that answer a different question: on a dark wall, at three metres, can this line be read? The four screens below are the delivery build; the three after them are wireframes from the same period. Compare them and you can see what never changed and what did.
Grey wireframes are good for structure. Set against the delivery build, the interesting part is not that it became prettier but three specific information-design calls.
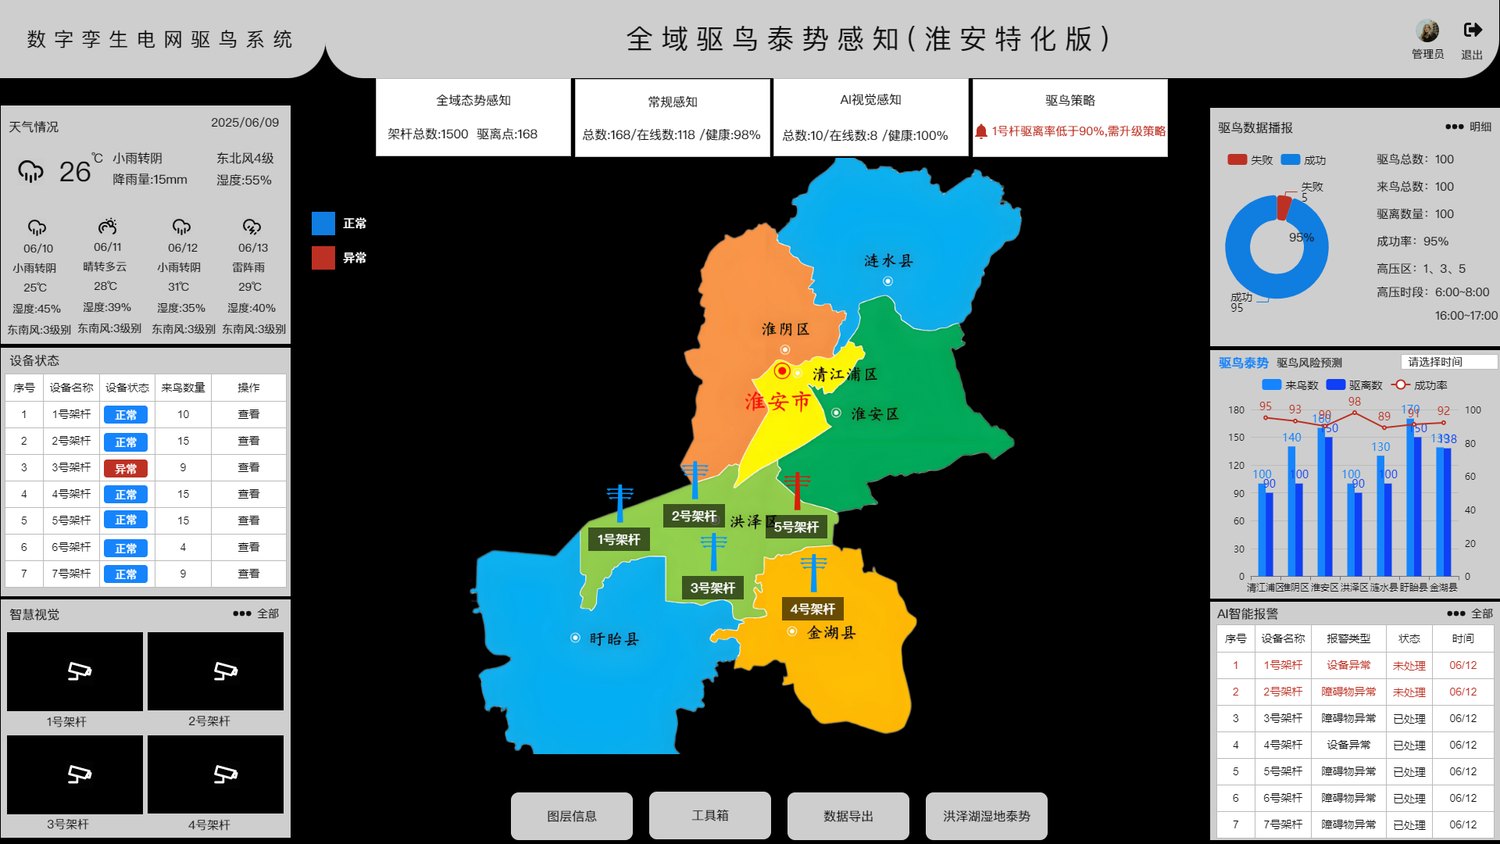
The wireframe's four top cards were blocks of explanatory text. The build keeps a label line and a number line with at least a 2× size difference, because operators scan the wall standing up: at three metres you read a number, not a sentence.
The wireframe showed alarms as a table with a header row. The build uses a header-less, newest-first list with open items in red. A wall cannot show scrollbars, and long device names wrap in fixed columns. The list trades density for "see the latest at a glance".
The wireframe map already had county polygons and tower labels. The build adds layer switching (base, markers, heat, forecast) and a toolbar instead of stacking a heat map on top of everything. Four questions, four views.
Deliverables & FAQ
The project shipped as three ends — wall, back end and mobile — plus six implementation documents. Schedule: 45 days, two weeks of testing, staffed with one designer, one front-end and two back-end engineers.
Six delivery steps: operating manual and documentation with optional video → two training sessions, before and after launch → testing, tuning and optimisation before go-live → launch plus system and document handover → day-to-day maintenance covering uptime, code updates, database backup and server care → after-sales guidance during use. The system runs on a dedicated server.
The hard part is never the page; it is integration. Device protocols, the video platform, maps and weather each come from a different supplier with different field names. Wrapping them in the ingest layer first is what keeps the pages from being tied to any one vendor.
As agreed, no client name, pricing or hours appear here; screens are delivery builds with demo device IDs, addresses and names.
Physical protection answers "where a bird cannot perch"; active repelling answers "a bird is here and must move on". Spikes, baffles and insulated covers are fixed once installed; laser, ultrasonic and acoustic output can change by season, by time window and by zone. The two do not compete: a core reserve relies on physical separation plus artificial nests, while corridors and general zones rely on active repelling — and the system manages the strategy and the evidence for the latter.
They are two different measures. 1,500 is the register that defines scope and responsibility; 168 is the number of installed repellent points, with 118 online and 98 healthy. Scope alone suggests full coverage; online counts alone hide the gap. Placed together, the shortfall is obvious — which is exactly why the strategy card raises its own alarm.
The system supplies leads, not verdicts. Every alarm carries a snapshot, device ID, confidence and timestamp; an operator checks the video and records the outcome as a real event or a false target. False alarms are not discarded; they are kept as a formal result, counted by device and by hour, and used to retune thresholds and the model. A meaningful share of the 194 records in this build are false targets, which is why the remarks field exists.
Three constraints. Permission: control actions are role-based, and start, sleep, boost and parameter changes all leave an operator and a timestamp. Interlock: sleep is tied to maintenance tickets, so a unit cannot start while someone is working at height. Visibility: every push is followed by a read-back, and the screen shows the reported value rather than the typed one. Laser units must also meet exposure-safety rules, and core reserves disable sound and light by default.
The wall is in the control room; people are in the field. During patrols, repairs and temporary closures, a crew lead needs to know which towers need a strategy change, which alarm is still open and what the weather is doing here. The app keeps reading and receiving only: three status cards, device list, broadcast, visual feeds, alarms. Control stays on the desktop, behind permission checks and a second confirmation. Doing less is what makes it hold up outdoors.
MORE CASES
A bird-hazard platform for a regional grid operator's transmission maintenance team, delivered as a ...
View Details →Start with our pricing logic, then let's talk requirements — cost structure, technology comparison and acceptance criteria, all laid out in the open.