
Cloud-factory mobile app for a precision-electronics plant
A smart-factory mobile app (Android / iOS plus a web management backend) for a precision-electronics...
View details →Most failed projects treat the five layers as a one-time purchase. What actually works is making each layer deliver value on its own and fund the next layer by itself.
Gateways, sensors, PLCs, and switches are supplied by you or your integrator. We provide the selection list and acceptance criteria, and we turn their signals into usable data. We don't mark up hardware, and we're not a cabling crew that disappears after installation.
On-time production reporting rate, visibility of equipment utilization, and traceability query time. We measure a baseline for all three before signing, then measure again at acceptance. If a client can't state a baseline and won't measure it, we don't take the project.
The production manager defines the metrics, the equipment supervisor defines the data points, quality defines the acceptance criteria, and IT defines the network and accounts. If one is missing, the project stalls on that person — the most common cause of delay, and almost never a technical one.
The five modules can be delivered independently or stacked. The table below shows typical scope, duration, and first-phase budget ranges, so you can judge how big phase one should be.
| Module | Problem it solves | Core functions | Typical duration | First-phase budget |
|---|---|---|---|---|
| MES / Manufacturing Execution | Where each order stands, which operation is the bottleneck, how much WIP there is | Work order dispatching, operation routing, barcode reporting, WIP dashboards, quality disposition and rework | 8–14 weeks | CNY 300k–800k |
| Equipment Connectivity & Data Acquisition | Utilization estimated by hand, failures reported by shouting, downtime reasons never recorded | Gateway acquisition, state detection, alarm push, automatic OEE calculation, equipment registry | 4–8 weeks | CNY 100k–300k |
| Shop-floor Dashboards | Data lives in the shift leader's head, and management can't see real progress | Output and takt time, exceptions and downtime, order progress, multi-screen rotation and role-based views | 3–6 weeks | CNY 50k–150k |
| IoT Platform | Devices are scattered across plants and customers, and every new device type means another code change | Thing model, device onboarding and authentication, rule engine, OTA, multi-tenancy and open APIs | 8–16 weeks | CNY 200k–600k |
| Automation Control | Critical process parameters drift, and veteran operators adjust them by hand | Closed-loop tuning, thresholds and interlocking, parameter downloads and auditing, exception and recovery logging | Per project | CNY 150k–600k |
When a dashboard doesn't work, the problem is almost never the dashboard itself but the five stages before it. Each stage has a typical latency — and a typical pitfall.
If these four rules aren't written into the design document, the system will need rework three months after go-live. They have nothing to do with technology — only with agreements.
L2-ST03-WELD01-CURR-A. Get the names wrong and every report downstream has to change with them.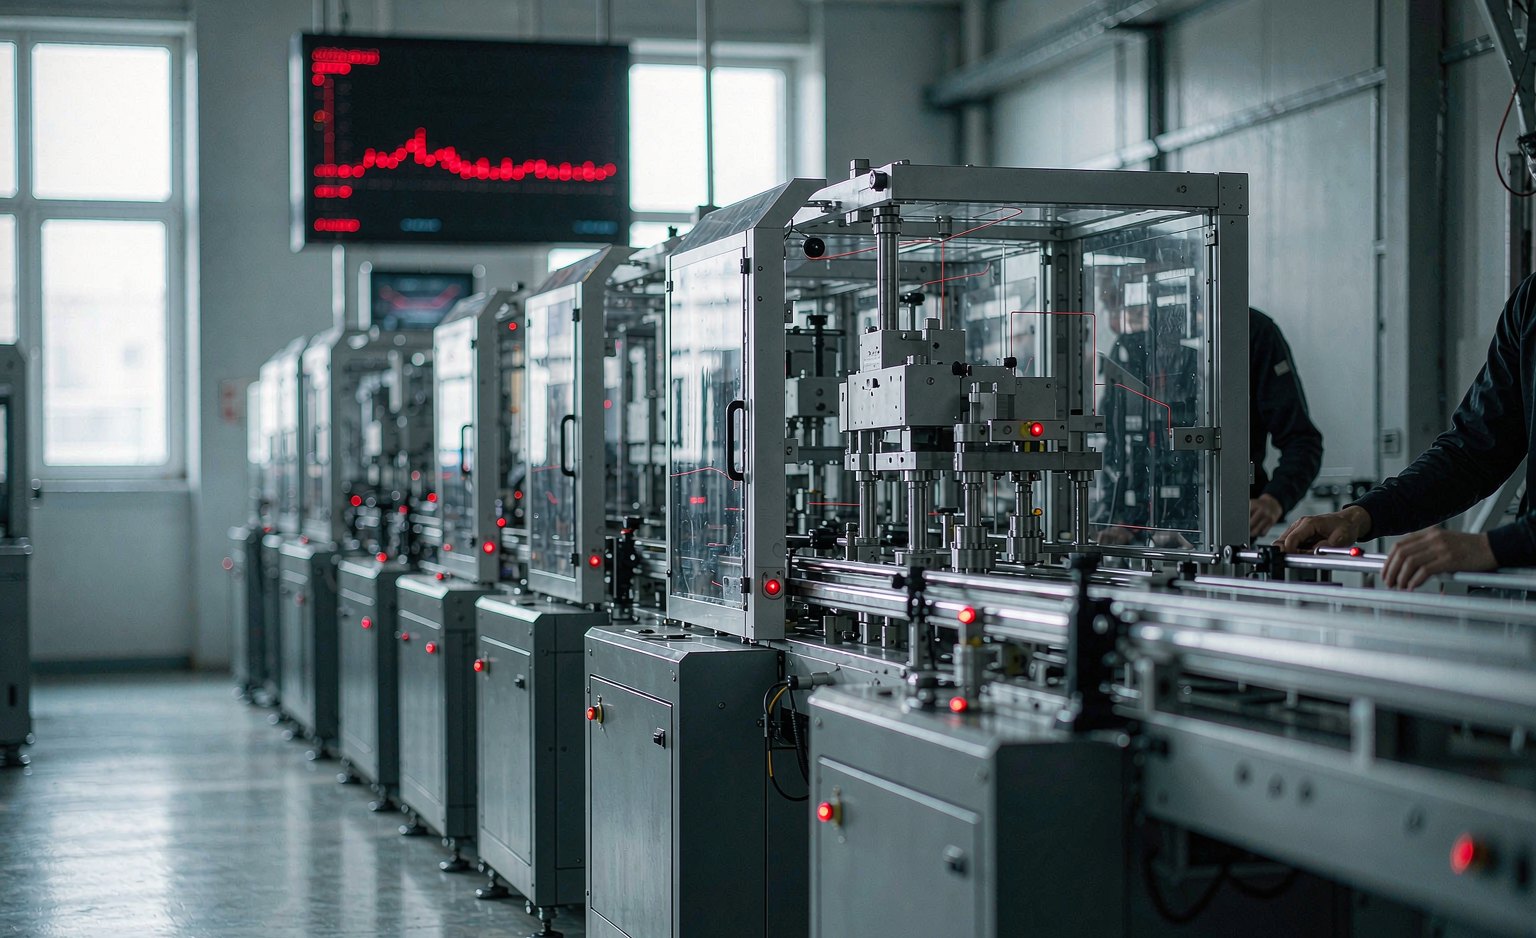
"It supports OPC UA" means ten different things at ten equipment vendors. This table is based on hands-on integration experience and is meant for estimating on-site effort.
| Method / protocol | What you can collect | Typical equipment | Difficulties | Incremental cost |
|---|---|---|---|---|
| Modbus RTU (RS485) | Register values, coil states | VFDs, temperature controllers, power meters, legacy PLCs | The vendor must provide the address table; the same register name means different things at different vendors | Low |
| Modbus TCP | Register values, coil states | Instruments with Ethernet ports, compact PLCs | Station number and port configuration; access conflicts with multiple masters | Low |
| OPC UA | Structured variables with types and semantics | Siemens, Beckhoff, and Rockwell current models | The vendor must expose a UA server and permissions; older models need a separate OPC service | Medium |
| Siemens S7 | DB blocks, M area, I/Q points | S7-200 / 300 / 400 / 1200 / 1500 | DB offsets must be computed from the data structure; symbol tables don't match across versions | Medium |
| Mitsubishi MC / Omron FINS | Data registers, link areas | Japanese PLCs and machine tools | Low serial speeds on older equipment limit the acquisition cycle to 200 ms or more | Medium |
| MQTT | Packets actively pushed by devices or gateways | Modern instruments, DTUs, AGVs, energy meters | Topic design, QoS levels, offline message buildup | Low |
| Vendor-proprietary serial protocols | Message frames parsed per vendor documentation | Weighing indicators, inspection devices, legacy special-purpose machines | Documentation is often missing and must be reverse-engineered from packet captures; the timeline is hard to control | High |
| IO / Dry contacts | Only on/off and present/absent | Legacy equipment, stack lights, safety doors, cylinders | No process values, only states | Low (and so is the information density) |
| Manual / Barcode entry | Tablet scanning at the station, manual data entry | Manual workstations, outsourced operations | Timeliness and accuracy depend on management, not technology | Low |
On the same machine in the same month, a different definition can produce a 15-point difference. So the first step isn't buying a system — it's writing the definitions of the three metrics into a table and having both sides sign it.
| Metric | Definition | Where the data comes from | Most common mistake |
|---|---|---|---|
| Availability A | Run time ÷ planned production time. Planned production time = calendar time − planned downtime (maintenance, no orders, holidays) | PLC run signal + production schedule | Counting planned downtime as loss keeps OEE low forever — and points improvement in the wrong direction |
| Performance P | Output time at theoretical cycle time ÷ run time (including idling, minor stops, and slow running) | Output count + standard process cycle time | Whether theoretical cycle time uses the "historical best" or the "nameplate rating" must be fixed once and never swapped mid-project |
| Quality Q | Good units ÷ total output. Total output includes trial-run parts and reworked parts | Quality inspection results + rework records | Trial-run parts quietly excluded make yield look high while the costs are real |
The thing model is the single contract between devices and applications. Define it once and both sides can evolve independently: replace a device without touching the app, change the app without touching the device.
| Thing model field | Example | Why it's required |
|---|---|---|
| Device ID | GW01-PRESS-07 | Unique and immutable. Rename, relocate, or move a device to another plant, and its history stays attached to the same ID |
| Point key | spindle_temp | Semantically stable and decoupled from register addresses. Swapping the PLC model only changes the mapping, not the reports |
| Data type | float / int / bool | Determines the storage type and how values are rendered; get the type wrong by one bit and the curve turns into a sawtooth |
| Unit and dimension | °C, mm/s, kWh | Whether conversion happens on the front end or the back end must be decided at design time — never compute it in both places |
| Precision and dead band | 0.1 / dead band 0.5 | Directly drives reporting frequency and storage cost. Without a dead band, a single temperature curve can consume a year of storage |
| Acquisition cycle | 1 s / 60 s / event-triggered | Calculate cost backward from time-series database capacity; not every point needs second-level resolution |
| Ownership dimensions | Line / Station / Customer / Contract | Determines who can see what and how costs are allocated. A multi-tenant platform without this column can't charge external customers |
Thresholds, N consecutive breaches, debouncing, in-shift accumulation, and linked work orders. Alarms must reach a person: who takes it, how fast they must respond, and who it escalates to. Otherwise it's just a wall of red on the screen.
Raw data is downsampled into minute, hour, and day tiers; raw values are retained for 1–2 years and aggregates indefinitely. Queries go through aggregate tables, so pulling up a curve from a year ago doesn't make you wait.
Asset registry, lifecycle, remote configuration, firmware upgrades, and rollback. Upgrades must support staged rollout: one device first, then one line, then the whole plant, with automatic rollback on failure — skip this step and you can brick every gateway in the plant.
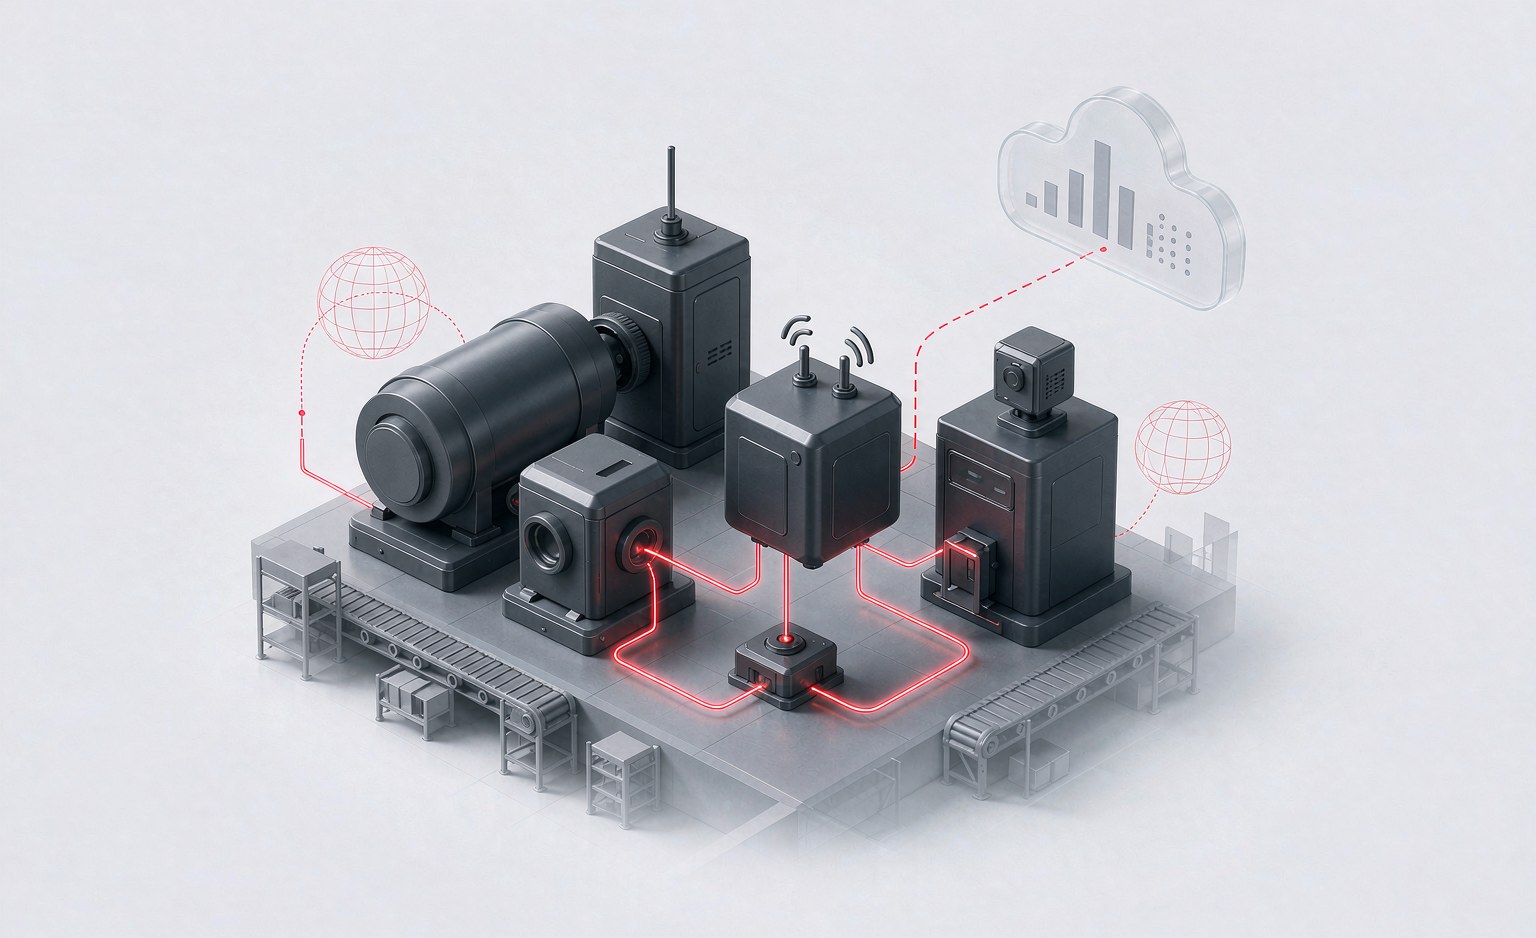
The edge handles what can't wait; the cloud handles what takes a long time to compute. Blur the two together and you either spend far too much or fall over the moment the network drops.
If an action must complete within 100 milliseconds, or must keep running even when the network is down, it belongs on the edge. Everything else goes to the cloud. By this criterion, the boundary is never blurry.
| Dimension | Edge only | Cloud only | Hybrid (recommended) |
|---|---|---|---|
| Acquisition latency | Milliseconds | 100 ms–2 s, affected by public network jitter | Millisecond-level decisions + second-level upload to the cloud |
| Availability during outages | Fully available | Data interrupted, control lost | Site keeps running, data is backfilled |
| History and cross-plant analytics | Limited capacity, hard to do | Strong | Strong |
| Cost per site | One box per line, hardware cost up front | Low, pay as you go | Moderate, but can be phased |
| Best suited for | Standalone machines, offline scenarios | Energy monitoring, remote operations | The vast majority of manufacturing sites |
A dashboard isn't "moving reports onto a wall." It serves exactly one scenario: a shift leader standing three meters away needs to know within ten seconds whether to call someone.
Shift output versus target, equipment exceptions, or order progress — pick one per screen. Try to show all three at once and none of them will be legible.
Primary numbers at least 120 px, with no more than 7 numbers per screen. Everything else drops to secondary information or comes off the screen entirely.
Normal states stay uncolored; only exceptions use red plus blinking plus sound, and must pinpoint the specific station and machine within 30 seconds. A screen covered in red, yellow, and green is the same as no signal at all.
Data as-of time, the statistical definition (including whether trial-run parts count), and the owner. Without these three lines, the floor starts doubting the numbers — and then stops looking at them.
Projects that skip step two and go straight to plant-wide MES usually end up eight months later with nothing but a dashboard nobody looks at. Here is the pace we actually use.
The same platform becomes a different set of data points and rules in a different industry. The table below lists scenarios we have delivered or assessed, spelling out what gets collected and where the value lies.
| Industry | What is collected | Typical applications | Where the value lands |
|---|---|---|---|
| Manufacturing | PLCs, robots, special-purpose machines, energy meters | Work order execution, utilization, quality disposition, predictive maintenance | Less downtime, higher first-pass yield, shorter changeovers |
| Logistics & Warehousing | Vehicle terminals, access control, temperature and humidity, weighbridges | Real-time fleet dispatching, route optimization, in-transit temperature control, dock queuing | Less empty running, better on-time rates, less cargo damage |
| Agriculture & Food | Weather stations, soil sensors, greenhouse actuators, sorting lines | Climate monitoring, greenhouse automation, batch traceability, sorting quality | Lower spoilage, traceability, pricing power |
| Energy & Environment | Electricity and water meters, gas sensors, emission monitoring | Sub-metering, peak and valley optimization, exceedance alerts, carbon accounting | Lower energy costs, manageable compliance risk |
| Healthcare & Laboratories | Cold-chain probes, reagent inventory, equipment operating status | Cold-chain break alerts, reagent expiry management, equipment utilization | Passing compliance audits, less consumable waste |
| Retail & Stores | Footfall counters, POS, refrigeration cases, lighting and HVAC | Footfall analytics, merchandising optimization, remote equipment control | Higher sales per square meter, lower maintenance headcount |
CASE STUDY
From a sorting line to a traceability system to full shop-floor digitalization — three deliveries at different levels of granularity.
A smart-factory mobile app (Android / iOS plus a web management backend) for a precision-electronics...
View details →
A reagent supply-chain management system for a hospital clinical laboratory, extended from the deliv...
View details →
A grading and sorting line for a food-processing plant: hyperspectral imaging, multi-sensor fusion, ...
View details →FAQ
This is the risk that is most often underestimated. Our approach: The workstation interface is designed with the participation of actual users, with on-site or remote supervision during the first two weeks of launch, and individual training by role with screen recordings kept. Link the actions that "must enter the system" to assessments (this requires internal promotion from you). Difficulty in using the system and employee resistance are often two sides of the same coin.
Defect repairs are free of charge during the warranty period (usually 12 months). After the warranty period, optional annual service packages or pay-per-use services are available for operation and maintenance. The billing items for both methods are clearly listed in the contract, and there is no vague "annual service fee" charged.
Yes, it's possible, and it's usually smoother. The typical division of labor is: you are responsible for servers, accounts, networks, and internal process decisions, while we are responsible for application code, interfaces, and deployment. Upon delivery, we will provide interface documentation and deployment manuals, and you can take over maintenance independently afterwards. We will then shift to providing support on a per-use basis.
Equipment list, protocols, collectible points, acquisition cycles — one page, clearly laid out, before we talk budget.

