
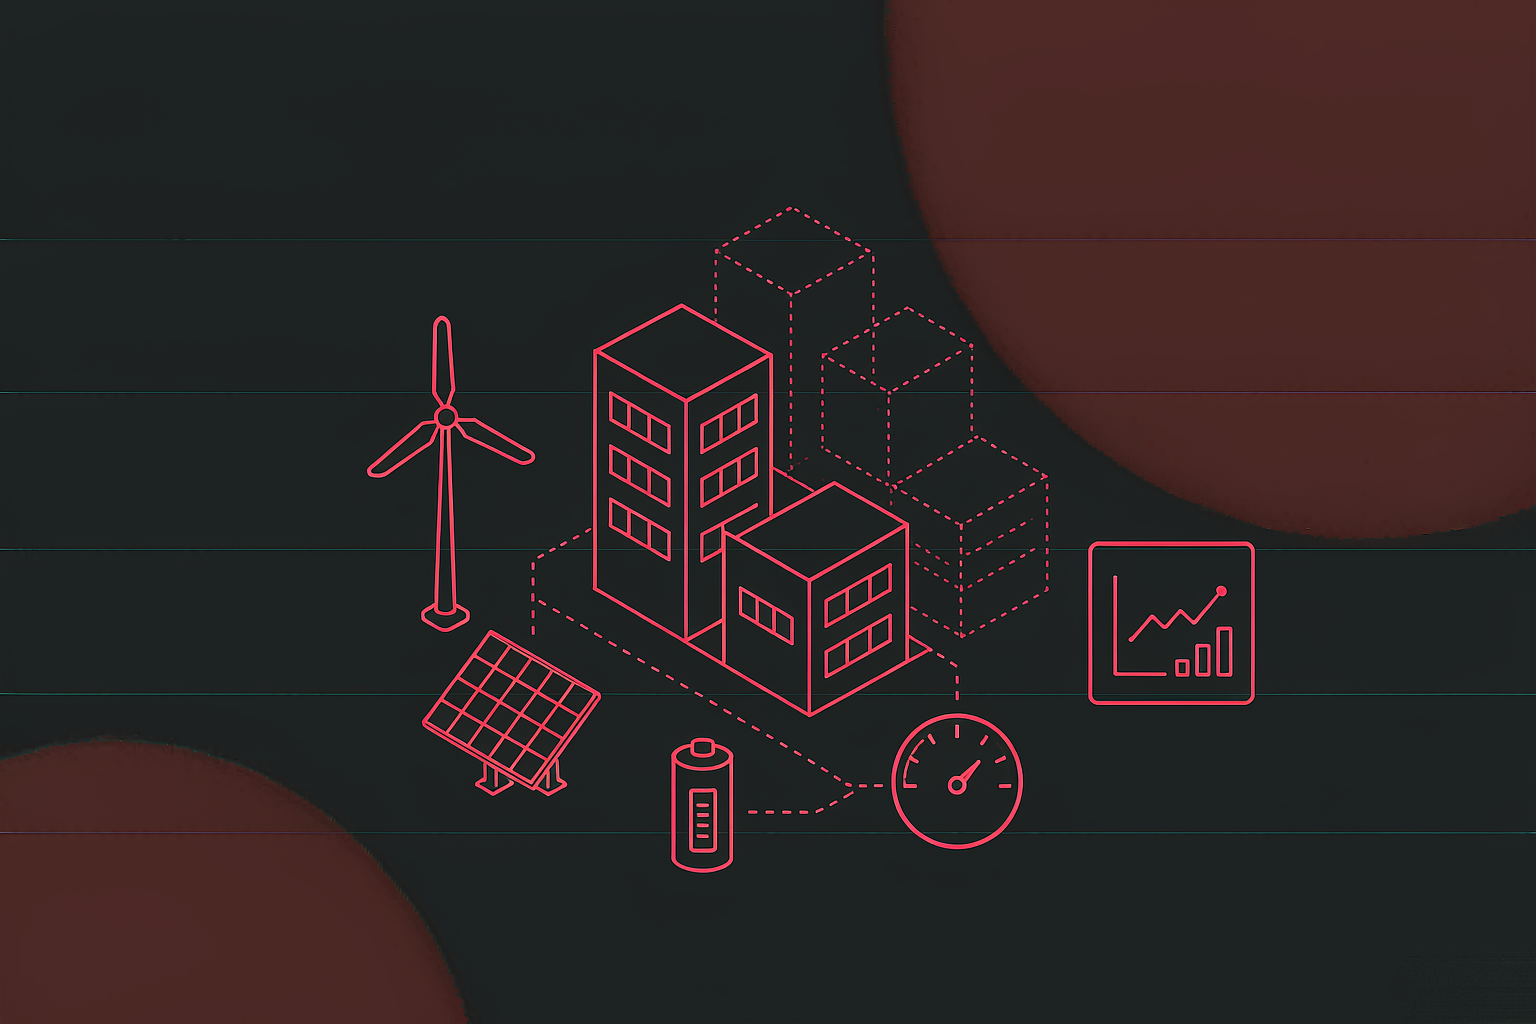
Campus PV energy platform
An integrated energy platform for an aviation-base campus, delivered as a 3D digital twin plus a 2D ...
View Details →The Load Profile
An aviation base cannot be described by a single total. Hangars keep lighting and ventilation running around the clock; the catering building starts prepping at four in the morning; offices run nine to six; charging piles rise and fall with vehicle arrivals. Rooftop PV only produces in daylight. Four load shapes share one incoming line, and the meter only says what was spent — not where, and not when it was wasted.
Lighting, ventilation and ground equipment in a maintenance hangar run all year. The load is flat but large, and there is no "switch it off" option. What is left is efficiency per unit of work and shifting what can shift — moving ground-equipment charging into the hours when PV output is high.
Catering starts before dawn and winds down mid-morning; offices fill at nine and empty at six. The two curves have completely different shapes, and on a monthly total they cancel each other out. Only by building and by hour does the real peak show up.
A single 480kW split charger at full output is a sizeable share of a catering building. How many vehicles arrive, when, and for how long decides whether the transformer is briefly overloaded. This load has to be read as a live power curve, not as daily energy.
The Safety Gate
An airfield is large, its roofs are continuous and its sun is good, which makes it look like ideal ground for distributed PV. It is also governed by obstacle limitation, electromagnetic environment and flight safety. Public reports on Chinese airport projects keep returning to three words: anti-glare, wake tolerance and electromagnetic interference. Those constraints decide what granularity the platform has to show PV at.
Specular reflection from modules can disturb pilots and tower visibility. Chongqing Jiangbei used anti-glare modules and adjusted array tilt and orientation to bring reflectance below 2%, meeting the civil aviation anti-glare standard. For the platform this means arrays must be viewable by location, not as one plant total.
Inverters, step-up equipment and cabling produce electromagnetic fields that need assessment near navigation and communication facilities, and runway-adjacent arrays must account for wake loads on their mounts. Taiyuan Wusu tackled exactly these three — glare, wake and EMI — for ground-mounted arrays inside the airfield.
Hangars and cargo terminals are long-span steel structures with significant thermal movement, and runway slopes are irregular. Chongqing Jiangbei added wind cables and installed in blocks. In the platform this becomes array zoning: different roof areas of the same building can be different generation units.
Sources: public reporting from CAAC News, the Ministry of Transport and the Wuxi SASAC (2026). Used for industry context and airport-specific constraints; unrelated to this project's installed capacity.
The Base Map
The usual failure is to build a beautiful set of buildings first and then try to push data into them; the model and the business never line up, and any layout change forces a rebuild. This platform does the opposite: fix the site and its coordinates first, hang devices on points second, add the energy-flow layer last. Each layer stands on its own, so a change in one does not topple the others.
Isometric campus: seven buildings modelled (marketing, services, admin, catering, MRO, new hangar, old hangar). Yellow roofs are PV arrays; yellow dashed lines carry PV from arrays to the switchroom and out to buildings; the blue dashed line feeds the EV station. Structural illustration, not the actual site plan.
Seven volumes, one main car park and two small ones, surrounding roads and green space, placed from the site plan and satellite base map at a single scale. The acceptance test is plain: put anyone who knows the campus in front of the screen and they should name each building at a glance.
PV arrays, chargers, HVAC plant, cooling towers and cameras each sit at a coordinate and are bound to a business key. Clicking a device does not open a picture; it opens that device's live data. Which is why the point table is itself a list the client has to sign off.
Current direction, cooling direction and charging power are layers, not part of the model. Switch one on and the lines move; switch it off and the campus is clean again. One model then serves briefing, duty and walkthrough without three versions.
Solar Chain
Campus PV is not four words of "self-generation, self-consumption". Power leaves rooftop modules, is combined and inverted to AC, stepped up to 10kV into the campus grid, then stepped down by each building's transformer to 400V for HVAC, lighting and chargers. Any break along that chain shows up as "less generation", but the cause can be completely different. The platform's job is to split "less" into "which segment".
The data sheet is explicit: live monitoring and generation statistics must support total, zone and single unit. That is three roles, not three decorations. Management reads total output and green share; operations asks which roof is low today; a technician checks one inverter's string current.
The hard part is naming. A zone must bind to a building and a roof surface, a single unit to a module ID and a string. Once naming drifts, the third level is permanently empty.
Devices run normal, fault, out of service. Out-of-service needs a reason — maintenance, shading, awaiting a part — otherwise a deliberate stop is counted as a failure and equipment health stops meaning anything.
The other category is safety data: temperature, fault messages, warnings. An over-temperature reading usually precedes soiling, poor cooling or a loose joint by a long way, and deserves its own alert rather than waiting for a trip.
| Parameter | Granularity | The question it answers |
|---|---|---|
| Live PV power | Total / zone / unit | How much now, and how far below yesterday at the same irradiance? |
| Generation (day / month / year) | Total / zone / unit | What share of the plan is done this month? |
| Equivalent full-load hours | Total / zone | At equal capacity, who is more efficient — and is the gap operations or orientation? |
| Avoided emissions | Total | The number used for carbon reporting, which has to survive an audit. |
| Safety data (temp / warnings) | Single unit | Is there an early signal — soiling, cooling or a joint? |
| Maintenance records | Single unit | Who serviced this, when, and what was done? |
Parameters come from the project data sheet v1.0, reorganised around who uses them and what for.
Charging & V2G
A campus charging station is typically one charger feeding many terminals: the 10kV substation feeds a split DC charger in the 480kW class, which allocates power to several DC terminals — liquid-cooled ultra-fast and standard fast, mixed by vehicle and site. Normally energy flows from grid to vehicle; under V2G it can flow the other way. That reversibility is what turns charging from a cost line into a dispatchable resource.
Chargers run normal, in progress, completed, fault, out of service. "In progress" and "completed" are business states, not device states — a gun delivering power and a car that just unplugged are both healthy equipment at different stages. Merge them and utilisation stops being measurable.
Charging count must be viewable in total and per-terminal orders; vehicle movements are counted separately. "100 sessions" and "60 vehicles" are not the same thing — one is transactions, the other traffic. Traffic drives the vehicle animation; transactions drive revenue analysis.
Charger and terminal temperature, fault messages and warnings belong on their own. High-power faults usually begin with a temperature rise, and protection acting means it is already late. A dedicated temperature curve beats a single "fault" flag.
HVAC & Floors
Cooling leaves the plant, passes through chilled-water and condenser pumps and the cooling tower, and reaches each floor through ducts. That chain sits above ceilings and inside shafts, so the owner normally sees one total cooling figure and one electricity bill. Floor explosion exists to turn "how much did this building use" into "is the vent on this floor actually working".
Floor explosion: five floors plus the roof pulled apart, AHU units on L3, PV arrays and a weather station on the roof. Only five buildings are exploded in the real project; long-span structures such as hangars are handled as a whole — the point is to reveal equipment relationships, not to show off.
Chillers, cooling towers, water chillers, chilled-water pumps and condenser pumps — the data sheet lists device types, but in operation they form one chain: the plant makes cooling, chilled pumps move it, towers reject heat, condenser pumps circulate. Any stop reduces cooling, but the shape differs: a plant stop is a cliff, a pump stop is a decline.
Air-handling units need parameters by space, flight information and time window, adjusting automatically against predicted footfall, solar gain and ventilation. That requirement fits an airport precisely: a flight wave brings a surge of people, and terminal and office rhythms are nothing alike, so one fixed schedule cannot serve both.
Colouring each floor by temperature and laying it over the stack is the most direct view in the platform. It does not replace the BMS, but it lets a non-specialist say "that floor is wrong" within a minute. Visualisation here lowers the cost of conversation, not of control.
| What to look at | Granularity | Basis for judgement |
|---|---|---|
| Live power draw | Total / zone / unit | Deviation from history at the same temperature and hour |
| Device distribution by floor | Building / floor | Which floor is densest, which is uncovered |
| Consumption statistics | Total / zone / unit | Year, month, week, day — for allocation and targets |
| Safety data | Single unit | Temperature, faults, warnings — plants and pumps differ |
| Maintenance | Single unit | ID, service time, technician, tied to the work order |
2D vs 3D
The original scope carried both a "3D visualisation platform" and a full "energy and carbon management platform" checklist — from demand declaration to consumption reports, from carbon accounting to maintenance tickets. These are not old and new; they are a division of labour. Move the 2D functions into 3D and both sides get worse.
| Question to answer | In 3D | In 2D |
|---|---|---|
| Which building, which floor, which position | Yes | — |
| Where energy flows, and whether it is flowing | Yes | — |
| Live situation for generation, load and charging | Yes | List backup |
| How much more than last month, and why | — | Yes |
| Whether maximum demand is over, and what to declare | — | Yes |
| Carbon accounting, green share, disclosure | — | Yes |
| Repairs, dispatch, service history, health | — | Yes |
| Briefings, site visits, explaining the campus | Yes | — |
The Data Bedrock
This project connects to more than one system: PV sits behind an inverter vendor's platform, charging behind an operator platform, HVAC behind a building management system, video behind a surveillance platform. Four vendors, four interfaces, four naming schemes. Design the screens first and you end up with a wall of empty cards. So before work started, the team did one thing: wrote down 25 parameters with granularity and source.
Data usually comes from the inverter vendor's cloud or a local gateway; power is sampled at high frequency, generation is aggregated per minute.
Interfaces typically come from the charging operator, order data needs paging and de-duplication by time window, and V2G discharge needs its own field.
Most of this lives in the BMS, usually over BACnet or Modbus. If the BMS is closed, the route is a gateway or independent meters.
Video connects over GB/T 28181 or a vendor SDK; AI recognition is an overlay that does not change the existing platform. Face features involve personal data, so scope and retention must be limited.
The brief is explicit: multiple systems managed under one data platform, unified sign-in through a portal or main cockpit, unified device authentication. In practice that means one account system, one role model, and visibility scoped per system — not four systems with four passwords.
Device faults, consumption anomalies and parameter anomalies need different responses: a fault sends someone to site, an anomaly first questions the data, a parameter alert may just be a bad threshold. Merge them into one list and the duty officer starts ignoring it within a week.
Two-phase Delivery
Every line in the quotation carries two ratios: how much is done at DEMO, how much at FINAL. Overall it is 0.8 to 0.2, but per line the split differs sharply — concept and UI reach eighty percent at DEMO, while 3D assets only reach thirty. That is not stalling; it is ordering the work so rework costs the least.
Concept, visuals, platform framework, home screen — eighty percent at DEMO, because they decide what this thing looks like and how it is structured. Get the direction wrong and every model and animation after it is wasted. Letting the client click through a DEMO beats ten document reviews.
Building models, equipment models and animation stop at thirty percent, because their precision depends on three things: accurate drawings, an equipment list and point coordinates. Those usually wait on the client and the vendors. Thirty percent proves the pipeline and the style; the rest lands in one pass when the inputs are complete.
Modules, presentation, UI/UX, scene and graphic definition
Site plate, buildings, floor split, equipment, car parks
Floor explode, vehicle charging, camera moves, shaders
UI build, asset loading, platform framework, three modules
PV, charging, HVAC and video data, reconciled
On-site deployment, roles, duty training, handover docs
Security & O&M
An energy platform has more than one user: the duty officer watches alarms, maintenance watches devices and tickets, management reads reports, security watches video. Four people, one system, and four different front doors.
Cameras map to points in the 3D scene, so one click brings up the picture. "Something alarmed here" and "what does here look like" become the same gesture instead of a switch to another video system and a walk down a tree.
Face for authorised access and exceptions, smoke for fire points in frame, workwear for compliance in MRO areas. Recognition assists, it does not enforce — every result needs a human check, and collection scope and retention must be bounded.
Repairs sort by time, area and urgency, and the system generates start and end times to close the loop. Tickets are not an accessory: equipment health and maintenance strategy are rebuilt from this table's history.
| Role | Should see | Should not see |
|---|---|---|
| Duty officer | Live alarms, device state, video | Contracts, pricing, personnel data |
| Maintenance engineer | Device records, service history, tickets, curves | Other departments' consumption detail |
| Energy manager | Demand, ranking, reports, carbon | Raw camera feeds |
| Management / visitors | Overview wall, green share, avoided emissions | Device control, parameter push |
Delivery & FAQ
This kind of project hands over more than software: models, effects, interfaces, documents and training. Miss one and it comes back as a question every week after go-live.
Scope → parameter and point tables signed off → concept and UI → DEMO review → models and motion → integration → FINAL review → deploy and train. The parameter table and point table are the two most under-estimated documents: until they are fixed, every later stage reworks.
If the client already has models or as-built drawings, the schedule compresses; if even the site plan has to be surveyed, budget time for survey and reconciliation.
Standard products are good at generic reports and device connectivity, and bad at the specific spatial relationships of these seven buildings, five floors and three systems. That spatial layer is the whole point here: which roof, which floor, which bay. SCADA can draw a diagram but cannot give a floor-penetrable 3D scene; SaaS can produce a report but will not connect into the campus's own 3D base. Hence standard capability plus a custom scene.
Four things: a site plan or satellite base map for position, architectural drawings for volume, an equipment list with photos for appearance and model, and point coordinates for mounting. The hardest to assemble is building photos and equipment appearance — drawings give dimensions, not material or colour.
Three routes in priority order: ask for an API or data push; request a read-only database account and agree a change-notification clause; add a collection gateway or independent meters and take the data physically. The third is the most expensive and the least dependent on the vendor. On our side the adapter layer is separate, so changing the route does not touch the screens above it.
The 2D one. The wall is for visits, briefings and central monitoring; daily work — tickets, reports, demand checks, parameter changes — happens in the 2D back end. Which is exactly why the project split into two lines instead of pushing every feature into 3D.
As the basis for internal accounting and trend management, yes; formal disclosure still goes through third-party verification. What the platform can do is aggregate consumption by category and sub-item, tag green energy separately, and keep emission factors and methodology in configuration rather than hard-coded. Then swapping a factor or adding evidence at audit time does not need a code change. Traceable data matters more than a handsome number.
MORE CASES
An integrated energy platform for an aviation-base campus, delivered as a 3D digital twin plus a 2D ...
View Details →
A bird-hazard platform for a regional grid operator's transmission maintenance team, delivered as a ...
View Details →Start with our pricing logic, then let's talk requirements — cost structure, technology comparison and acceptance criteria, all laid out in the open.