
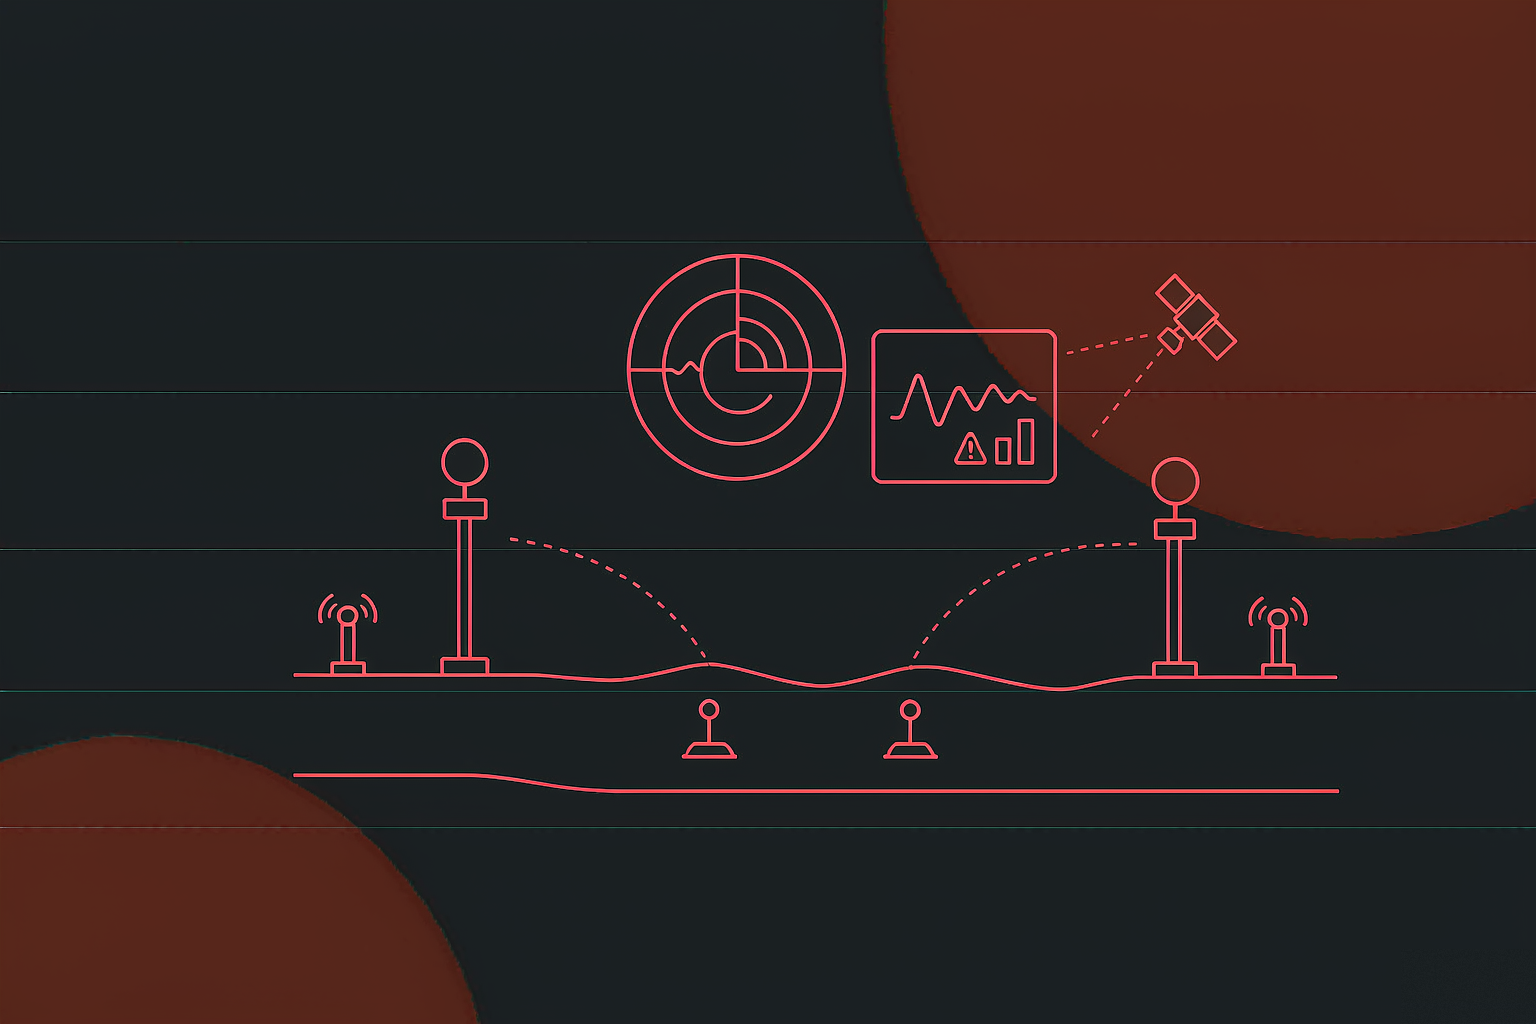
Yellow River dynamic monitoring & early-warning system
A dynamic monitoring and early-warning system for a river authority: space-air-ground IoT devices se...
View Details →System Overview
Username and password land directly on the initial page where three modules sit in one row — the river watcher, the server-room watcher and the device watcher, each in its place.
The River Eye
The eye aggregates the monitored reaches managed by each unit. Of the five functions, three are built into the system and two jump to mature platforms — each used for what it does best.
The jump is not an escape: entries stay inside the eye, so from dam monitoring to a drone flight or a meeting is one click.
Dam devices stretch for dozens of kilometres along the channel; a table ledger is slow to query. The satellite map puts device positions, alarm records and the river back into their real geography: where it is, where the alarm is, which dike section is closest — located at a glance.
Filtering matters just as much: once devices multiply, filtering by device info lets the duty officer watch only the current class.
Live views answer “how is it now”; playback answers “what just happened”. Flood hazards are often reconstructed after the fact, and live plus playback turns surveillance from watching into evidence.
The gallery looks soft but serves mobilisation and after-action records: photos and videos archived by column, browsed through two levels of detail pages.
Integration Strategy
The intro says it plainly — “data consolidation and hardware-software integration”. On the architecture it is one picture: the system in the middle owns the unified entry and the data; three third-party platforms at the edges own their deep capabilities.
Clients often ask “can we build it all ourselves?”. This system answers no: drone patrols and video meetings have mature platforms with deep, fast-moving capabilities — a rebuild would only produce a worse version. What the system adds is the unified entry: no duty officer memorises platform addresses; from the eye, one click and they are there.
The smart server room guards the bottom line of “the system stays online”: a third-party control system is linked for data interconnection, and a third-party cloud platform monitors the room. A monitoring system runs on its server room, so room status must be as visible as water levels — a first-class module, not a settings page.
Device Manager
Entering the device manager shows the jurisdiction network topology by default, device statistics on the left, and rolling alarm and fault analysis — the devices’ check-up report on one screen.
The two classes fail differently: a regular device fails as “offline”, a sensor fails as “still reporting, reporting wrong”. Separate lists keep the fault analysis from mixing the two problems, and the statistics (total devices / total sensors / total faults) follow the same split.
Alarms today and faults today say how many happened; unhandled says how many are still pressed. The first two only grow; only the unhandled count can be actively cleared by the duty shift — the one number that shows whether the shift is on top of things, hence the emphasis.
Alert Loop
An alarm that only rings once is worthless. The system chains the alarm, the list, the view and the record — every step carries the entry to the next.
Full-cycle Support
The intro names three jobs — pre-flood warning, in-season crew dispatch, post-flood assessment. On the modules, each phase has functions actually doing the work.
The eye’s dam monitoring and video watch the levee and channel around the clock; the device manager watches the sensors themselves — warning presupposes devices online, and a dead sensor is known first.
Meetings open in one click, drone patrols fill the blind spots, and the unhandled list gives dispatch its basis — crew movements follow the data and the picture.
Historical alarms and faults roll in the archive, video playback serves as evidence, the gallery keeps site imagery — assessment reads the system, not notebooks.
FAQ
The eye is the dynamic monitoring board that gathers the scattered “eyes” of each unit: dam monitoring marks dam-defence devices and alarm records on a satellite map, drone patrols fly mobile routes, video surveillance offers live views and playback, meetings open in one click, and the gallery keeps bureau photos and videos. Parts of the lower Yellow River run above the surrounding land — the levees of these “suspended” reaches are exactly what flood control watches, hence the name.
Both have mature platforms; the system links rather than rebuilds: after login, one click and you are there, with no change of habits. The system owns the unified entry, data interconnection and the device ledger; each platform owns its depth. The server room works the same way — a third-party control system is linked for data interconnection and a third-party cloud platform monitors the room.
The full device ledger: the jurisdiction network topology by default; on the left, total devices, total sensors and total faults, with the device list split into regular and sensor devices; alarm and fault analysis rolling on screen; daily statistics giving alarms today, faults today and unhandled today, with historical alarms and faults scrolling for review.
Three systems for the same river authority, each covering a stretch: the smart application platform runs daily business, the ice-flood AI forecasting system covers winter ice floods, and this dynamic monitoring and early-warning system covers year-round sensing, devices and dispatch — pre-flood warning, in-season dispatch and post-flood assessment each have their supporting modules.
Deliverables & Results
The most direct change: more eyes. Monitoring, drones and video once scattered across units now share one entry; dam devices and alarm records sit on the satellite map; duty shifted from ledgers and phone calls to one picture.
The second change is on the device side: topology for coordinates, stats for totals, the ticker for changes — the unhandled count became the duty scorecard; after a fault, the live dam view opens from the same screen, and remote judgement precedes the site visit.
The third change is after the flood: historical alarms, historical faults and video playback stay in one system, so assessment traces evidence instead of memory. As agreed, this page shows no client name and no production screenshots.
Building a flood monitoring and early-warning system? Settle three questions first: where the build-versus-integrate line runs, how the device ledger maps onto the topology, and how alarms close the reminder–list–site–record loop.
MORE CASES
A dynamic monitoring and early-warning system for a river authority: space-air-ground IoT devices se...
View Details →
An ice-flood AI forecasting and monitoring system for a river authority: cameras, drone patrols, wea...
View Details →
A smart application platform for a Yellow River authority: space-air-ground IoT sensing of hydrology...
View Details →Start with our pricing logic, then let's talk requirements — cost structure, technology comparison and acceptance criteria, all laid out in the open.